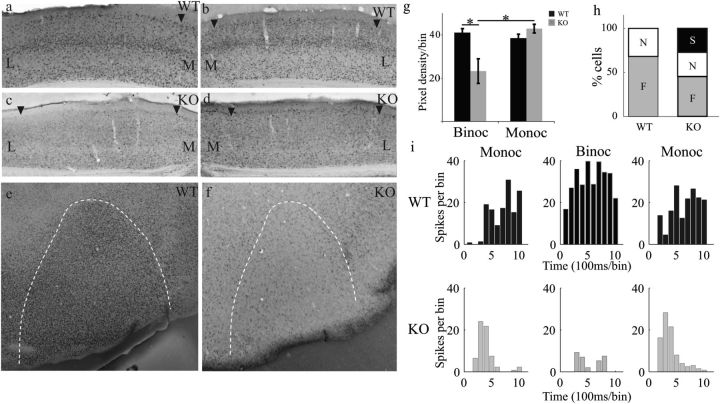
Figure 5.
Binocular stimulation induces suppression in V1. (a–d) Coronal sections through the left and right hemispheres of V1 from WT (a,b) and Ten-m3 KO (c,d) mice following binocular stimulation. WT mice display uniformly high levels of c-fos reactivity across both hemispheres, whereas much lower levels of staining are seen in KOs. Arrowheads mark V1 boundaries. Scale in a: 500 μm, applies to a–f. M: medial, L: lateral. (e,f) Tangential sections through layer IV of V1 in WT (e) and Ten-m3 KO (f). KOs exhibit markedly reduced activity across the whole of V1. (g) Quantification of c-fos immunoreactivity in WT and KO mice following binocular and monocular stimulation. Pixel density (mean ± SEM) was significantly higher across the whole of V1 in WTs versus Ten-m3 KOs under binocular viewing, but this was rescued under monocular viewing, with WT and KO immunoreactivity at similar levels. *P < 0.05, for details, see Results. (h) Proportion of cells that were facilitated (F), showed no change (N), or were suppressed (S) in WTs and Ten-m3 KOs. In WTs, over two-third of cells were facilitated, and the remainder showed no change during binocular versus contralateral monocular stimulation; no WT cells showed suppression. In KOs, there was a significant increase in the proportion of cells, which showed suppression, and the number of facilitated cells was reduced (6 of 22 cells exhibited suppression in KO compared with 0 of 22 cells in WT, P < 0.05, Fisher's exact test). (i) Poststimulus time histograms showing responses from typical WT cell (top) and an example of a KO cell which exhibited suppression (bottom). Panels show activity during contralateral monocular stimulation (Monoc, left), binocular stimulation (Binoc, middle), and a return to contralateral monocular stimulation (right). Note the almost complete suppression of activity under binocular stimulation in the KO cell.

