
Figure 3.
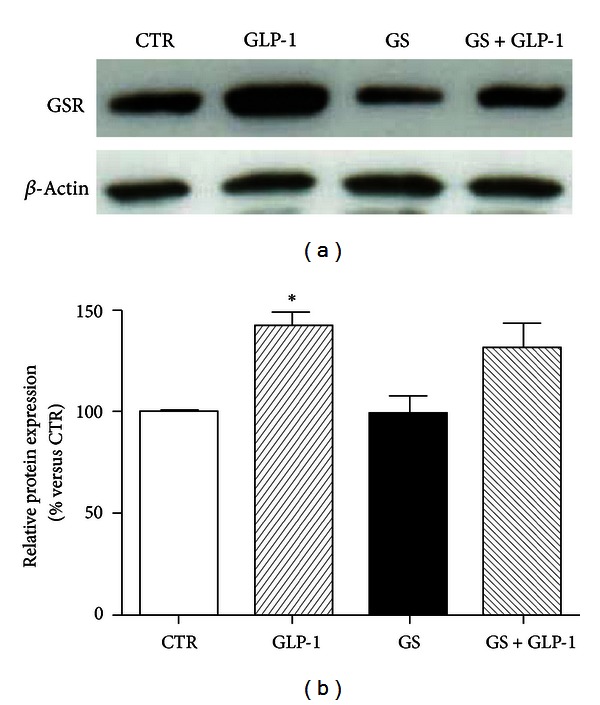
GLP-1 does not affect GSR expression in HIT-T15 cells cultured with AGEs. (a) Representative western blot of three different experiments. (b) Quantification of densitometries of western blot bands. Data were expressed as mean ± SE of fold induction relative to β-actin (n = 3). *P < 0.05 versus CTR.