
Figure 7.
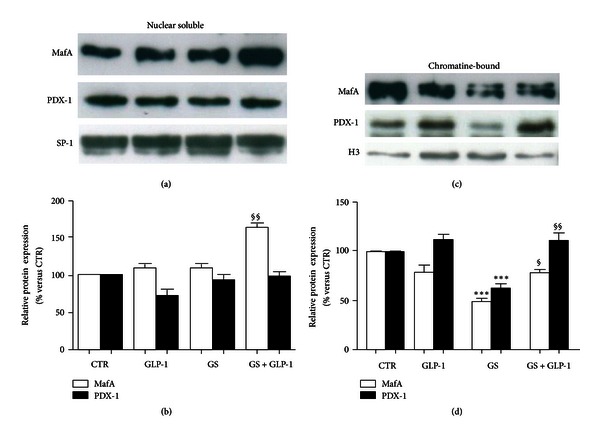
Effects of AGEs on nuclear distribution of MafA and PDX-1. Western blot analysis of nuclear soluble (a-b) and chromatin-bound (c-d) localization of MafA and PDX-1. (a) Representative western blot of three different experiments. SP-1 amounts were analyzed as a loading control. (b) Quantification of densitometries of western blot bands. Data were represented as percentage change from CTR level (100%) (n = 3). (c) Representative western blot of three different experiments. Histone H3 (H3) amounts were analyzed as a loading control. (d) Quantification of densitometries of western blot bands. Data were represented as percentage change from NGS level (100%) (n = 3). ***P < 0.001 versus CTR; § P < 0.05 and §§ P < 0.01 versus GS.