
Fig. 5.
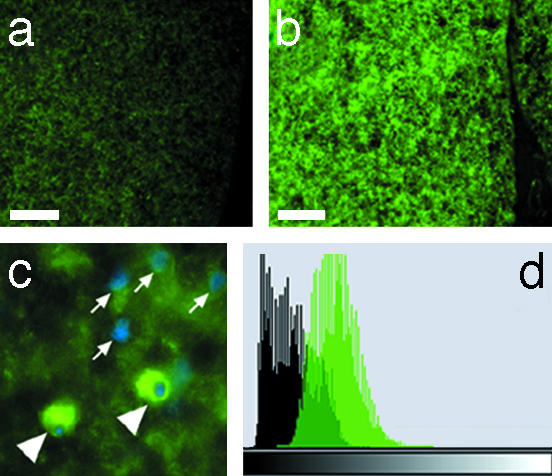
(a and b) CNPase immunocytochemistry demonstrating increased oligodendrocyte preservation in minocycline-treated rat spinal cord ventral funiculi 4 mm caudal to the epicenter (b) vs. that in the controls (a) (n = 8 rats per group). (Scale bar = 75 μm). (c) Anti-CNPase and 4′,6-diamidino-2-phenylindole (DAPI) double-staining, demonstrating oligodendroglia (arrowheads) as well as the nuclei of cells not reacting with the anti-CNPase antibody (arrows). (d) Composite histograms of total luminosities summarized from each experimental group showed a significant difference in anti-CNPase immunoreactivity (i.e., brightness intensity of the immunostain as measured by luminosity units) between the minocycline-treated (green) vs. the vehicle-treated (black) rats (n = 8 rats per group, with group average luminosity of 73.8 ± 3.5 luminosity units vs. 26.1 ± 1.9 luminosity units, respectively; P < 0.001, unpaired Student's t test). The histograms represent the distribution of total pixels (y axis) in the measured sections (480,000 pixels per section, 1 section per rat, and 8 sections per group for a total of 3.84 million pixels per group) of each group, plotted against luminosity units (x axis) where luminosity ranges from luminosity unit 0 (black) to 256 (white).