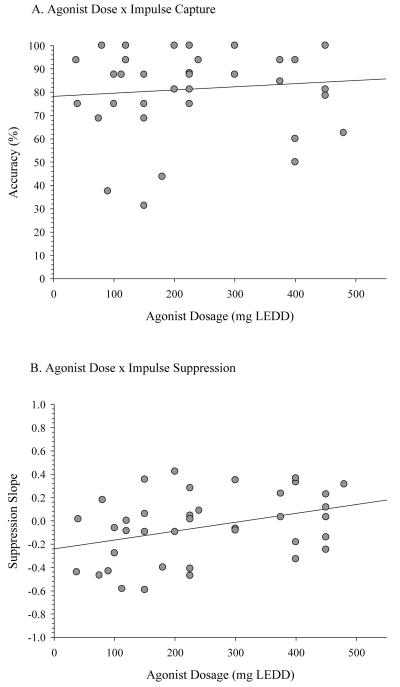
Figure 6.
Scatterplots depicting (A) the absence of an association between agonist dosage and fast, impulsive errors, and (B) the significant positive association (r=.37) between agonist dosage and the suppression slope from the final segment of the delta plot. In panel B, more positive slope values reflect less proficient inhibitory control. Agonist dosage is expressed in milligrams levodopa equivalent daily dose (LEDD).

