
Figure 1.
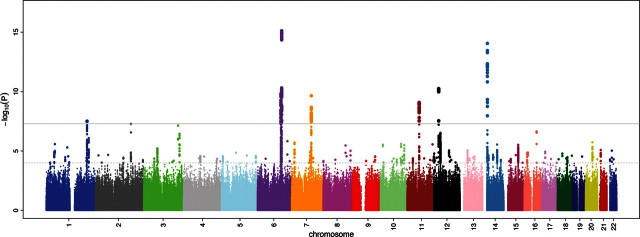
RR interval association results for ∼2.5 million imputed autosomal SNPs in 38 991 individuals from 15 cohorts. Results are shown on the −log10(P) scale (y-axis). The x-axis depicts chromosomal position. The gray horizontal line corresponds to the genome-wide significance threshold of P = 5 × 10⁻⁸.