
Figure 2.
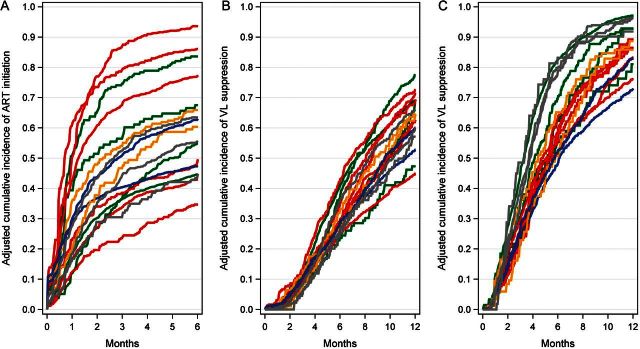
Adjusted cumulative incidence of antiretroviral therapy (ART) initiation and virologic suppression, by jurisdiction, 2001–2009. A, ART initiation, through 6 months after eligibility. B, Virologic suppression, through 1 year after eligibility. C, Virologic suppression among ART initiators, through 1 year after initiation. Estimates were adjusted for age; race/ethnicity; sex; transmission risk; documented history of non–injection drug abuse, alcohol abuse, and mental illness; CD4+ count and viral load at eligibility; calendar year; type of cohort; and clinic-specific mechanisms undertaken to assist with access to ART. Colors used to identify geographic regions: blue = Northeast United States; green = Western United States; gray = Canada; orange = Midwest United States; red = Southern United States. Abbreviations: ART, antiretroviral therapy; VL, viral load.