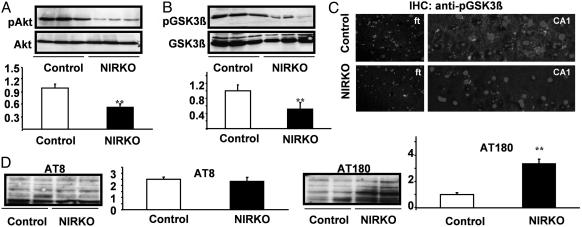
Fig. 2.
Neuronal insulin resistance causes Tau hyperphosphorylation in vivo. (A) Western blot analysis of brain extracts derived from individual randomly fed mice with antibodies against Akt or pAkt (Ser-473). (Lower) The densitometric quantification as mean ± SEM [control (open bars) and NIRKO (filled bars) mice] of at least eight animals of each genotype is shown (**, P < 0.01 by unpaired Student's t test). (B) Western blot analysis of brain extracts derived from individual randomly fed mice with antibodies against GSK3β or pGSK3β (Ser-9). (Lower) The densitometric quantification as mean ± SEM [control (open bars) and NIRKO (filled bars) mice] of at least eight animals of each genotype (**, P < 0.01 by unpaired Student's t test). (C) Immunohistochemistry of layer V of the frontal cortex (Left) and the pyramidal cells of the CA1 region of the hippocampus (Right) with antiserum specific for pGSK3β (4′,6-diamidino-2-phenylindole counterstaining). (D) Immunoblotting of protein extracts from whole brain lysates of control and NIRKO mice with the AT180 (paired helical filament-Tau phosphorylated at Thr-231) and AT8 (paired helical filament-Tau phosphorylated at Ser-202) antibodies. Data represent mean ± SEM [control (open bars) and NIRKO (filled bars) mice] of at least six animals of each genotype (**, P < 0.01 unpaired Student's t test).

