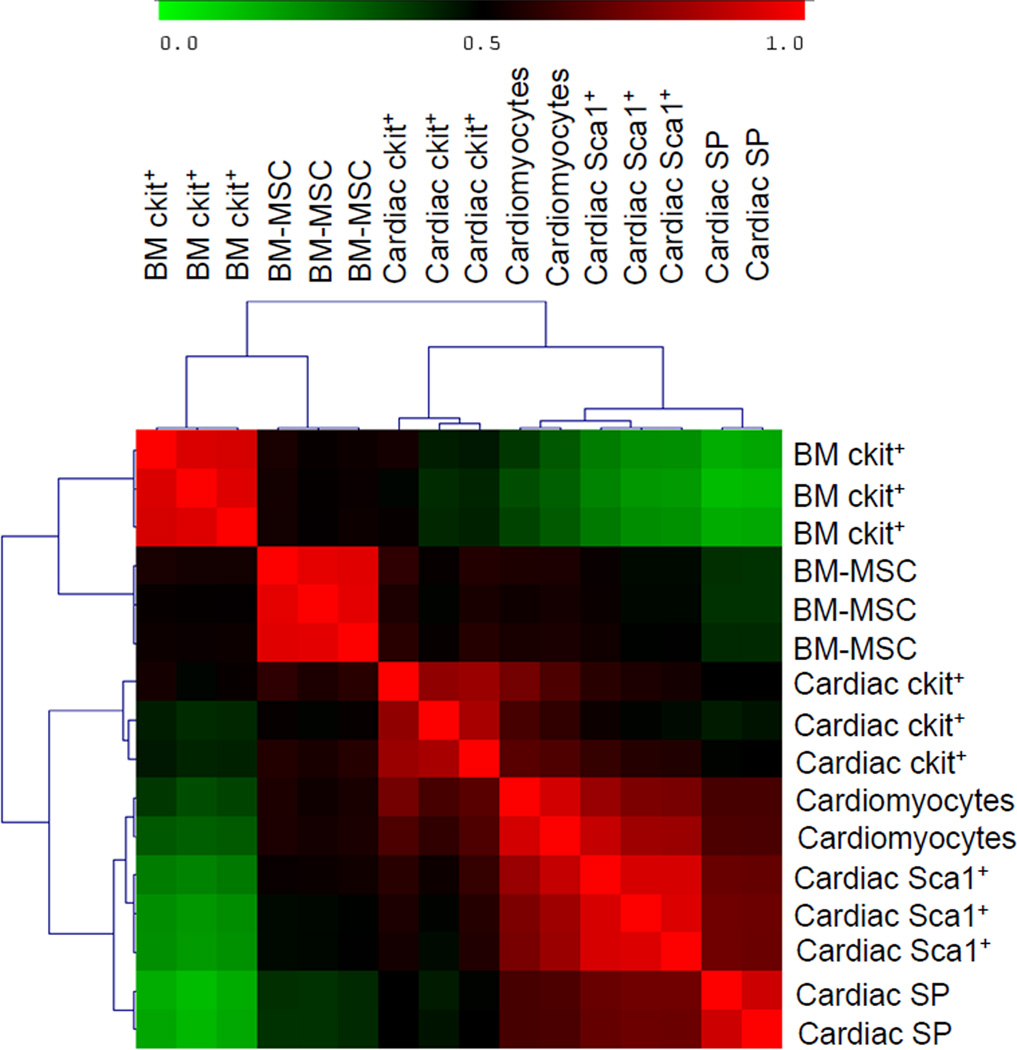
Figure 6. Hierarchical clustering among cardiac-derived and bone marrow-derived cells.
Correlation among the three cardiac-derived CPCs, cardiomyocytes, and BM-derived cells, represented as a hierarchical cluster matrix, based on Pearson’s correlation test of significant (p<0.05) differentially expressed genes (≥ 2-fold) among all samples. Red represents high correlation; green represents poor correlation.

