Figure 3.
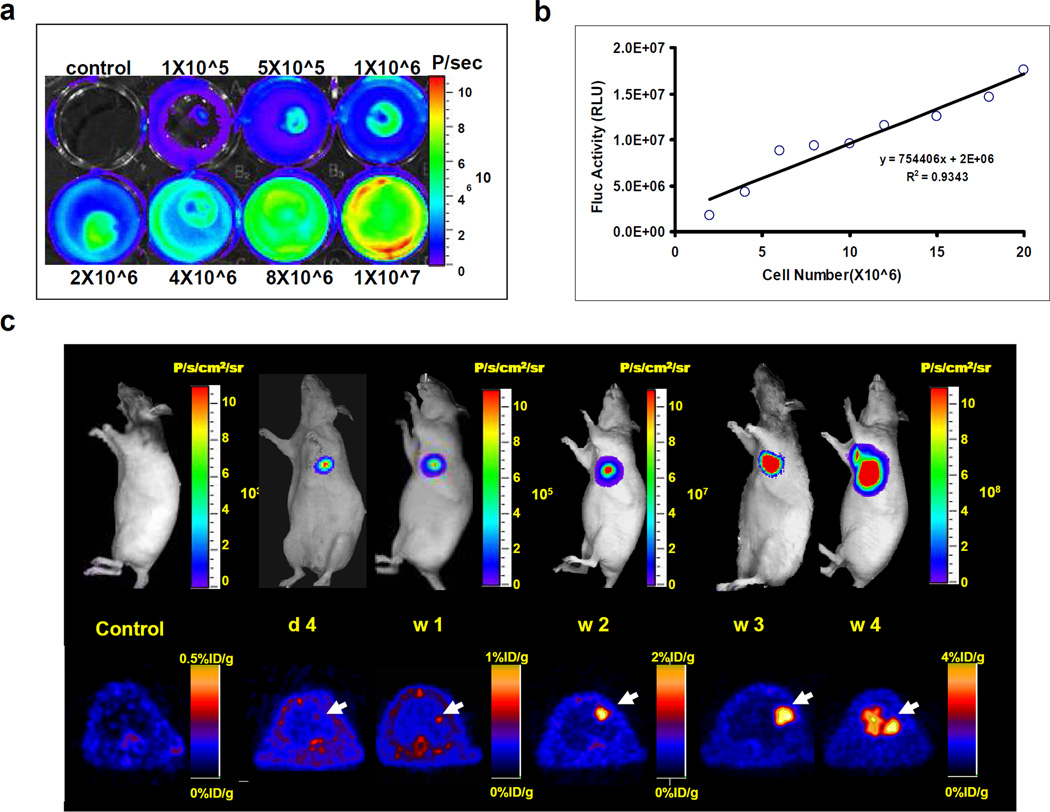
Reporter gene imaging of ES cells in living animals. (a) of Fluc positive ES cells. (a) Cell plate imaging of TF positive ES cells. 1×10⁵, 5×10⁵, 1×10⁶, 2×10⁶, 4×10⁶, 8×10⁶, and 1×10⁷ mouse ES cells were plated in a 6-well plate. (b) Linear correlation of cell number and BLI signal (photons/second/cm2/steradian) reveals a strong correlation (R2=0.93). (c) Longitudinal imaging of transplanted ES cells in an immunodeficient nude rat. Transplantation of 1×10⁷ ES cells into the myocardium leads to teratoma growth by week 4 as monitored by progressive increases in BLI and PET signals. For PET images, the animal was injected via tail vein with close to 100 μCi of the PET reporter probe [18F]-FHBG. Images were acquired 1 hour after radiotracer administration to allow for adequate biodistribution. (Reproduced from reference #4 with permission from Lippincott Williams & Wilkins)

