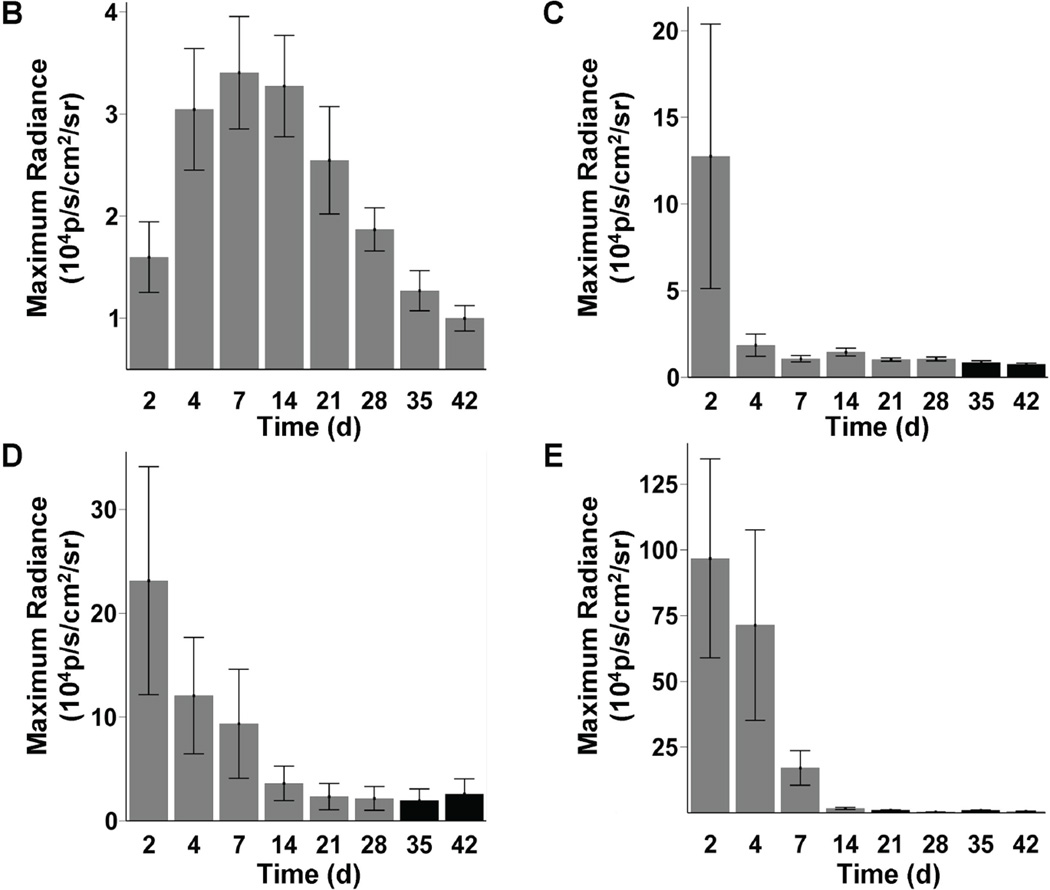
Figure 3. Longitudinal in vivo optical bioluminescence imaging (BLI) of transplanted cell survival.
(a) Images from the same representative animal from each group reveal cell proliferation, death, and migration. MN show retention in the heart, and furthermore can home in on the femur, spleen, and liver (yellow arrows). BLI images from animals 2 days after injection of SkMb, MSC, and Fibro show retention not only in the heart, but also in the lungs (red arrows). Decreasing signal intensity over time is indicative of acute donor cell death in these groups. Scale bars represent BLI signal in photons/s/cm2/sr. (b) Quantification of BLI signals on fixed regions of interest (ROI) over the heart reveal an early increase in signal from day 2 until day 7 in the MN group, while signal intensity in the SkMb (c), MSC (d), and Fibro (e) groups clearly decreases until background signal (black bars) at week 3 to 4. Bars represent mean ± SEM.


