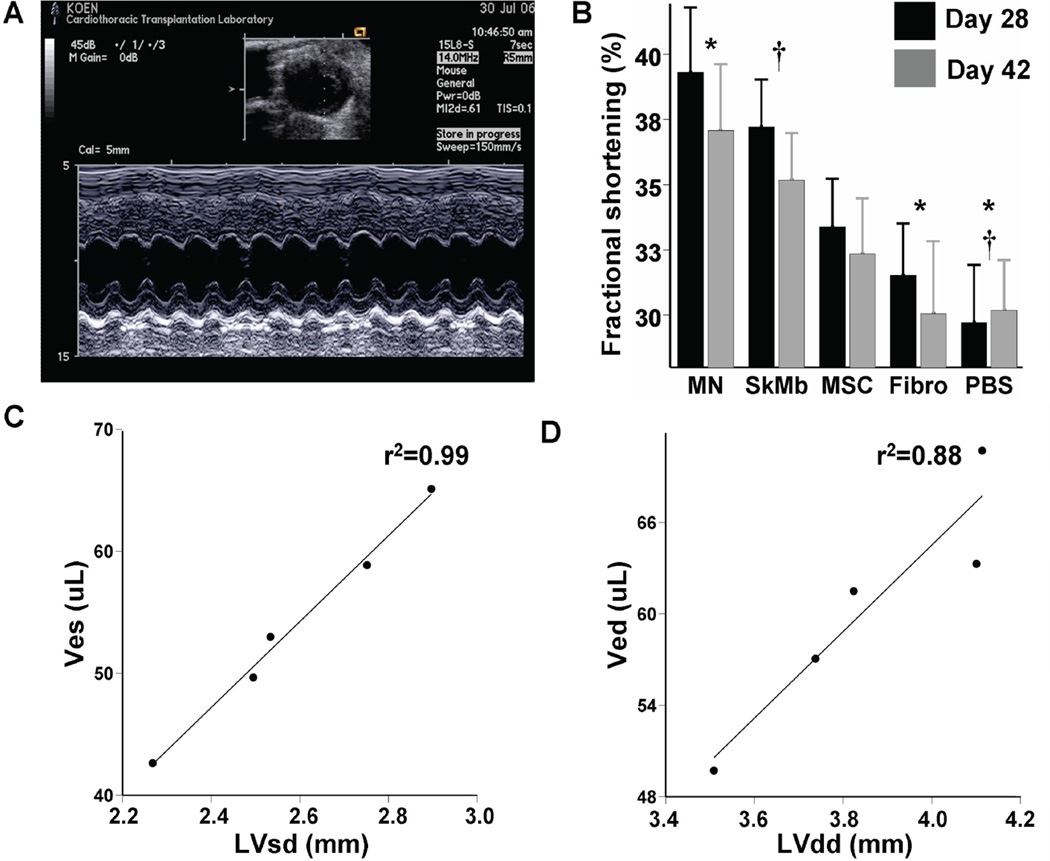
Figure 5. Measurements of functional consequences of cell transplantation into the infarcted mouse heart.
(a) Representative M-mode traced picture taken at the level of the papillary muscle whereby left ventricular diameters can be measured. Scale bar is included on the left side. (b) Quantification of LVFS at 4 weeks (black) and 6 weeks (grey) after myocardial infarction and cell transplantation. MN appear to have the greatest functional protective effect compared to other groups. However, there is a general trend toward decreasing cardiac performance at 6 weeks instead. Immediately after echocardiography at week 6, invasive three-dimensional steady-state measurements of ventricular volumes at end-systole (Ves) and end-diastole (Ved) were conducted. Non-invasive echocardiography and invasive hemodynamic measurements correlate robustly between (c) Ves vs. LVsd (r2=0.99) and (d) Ved vs. LVdd (r2=0.88). Bars represent mean±SEM. MN (*) or SkMb (†) vs. indicated groups: P<0.05.

