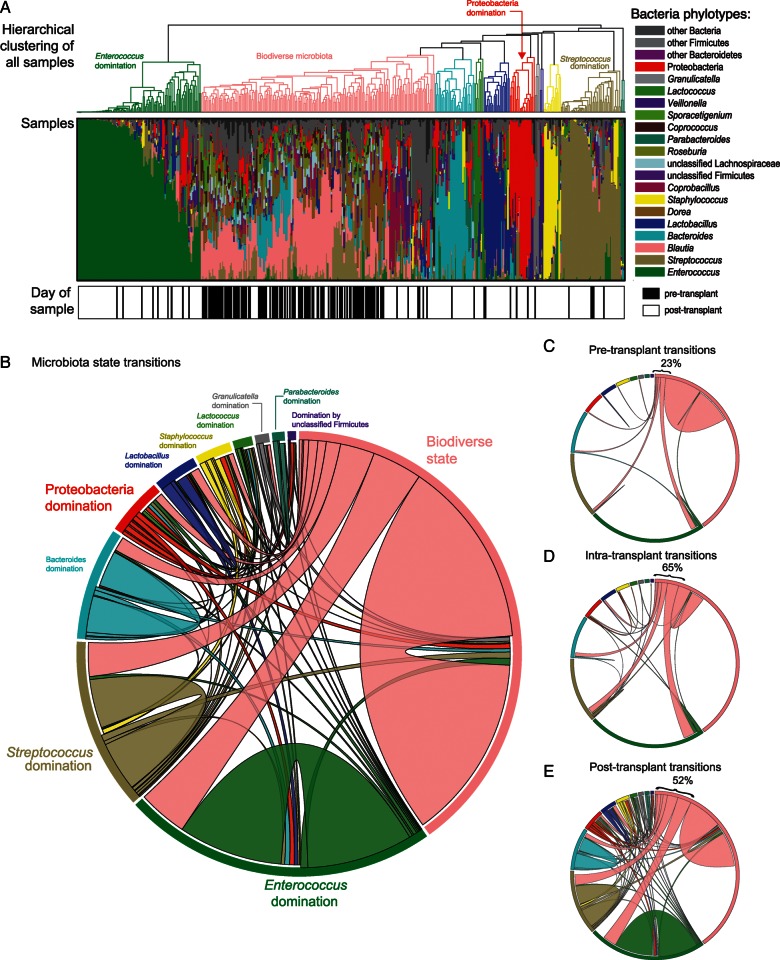
Figure 3.
Microbiota states and their transitions. A, Hierarchical clustering of all fecal specimens according to microbiota state based on phylogenetic classification. There was wide variation in phylogenetic composition; some specimens showed a relatively biodiverse membership, whereas others were largely dominated by a single bacterial taxon. B, Circos plots representing microbiota state transitions between consecutive specimens within the observation period. Subplots of transitions during specific transplant periods are shown in C–E. C, Pre-transplant transitions revealing that patients in the “biodiverse microbiota” state tend to remain in that state; resilience of the “biodiverse” state, measured as the percentage of consecutive specimens that remain in that state, is 77%. D, Resilience of “biodiverse” state decreasing to 35% during the intra-transplant period (consecutive specimens straddling the day of stem cell infusion). E, Post-transplant transitions with the “biodiverse” state resilience staying low at 48%.

