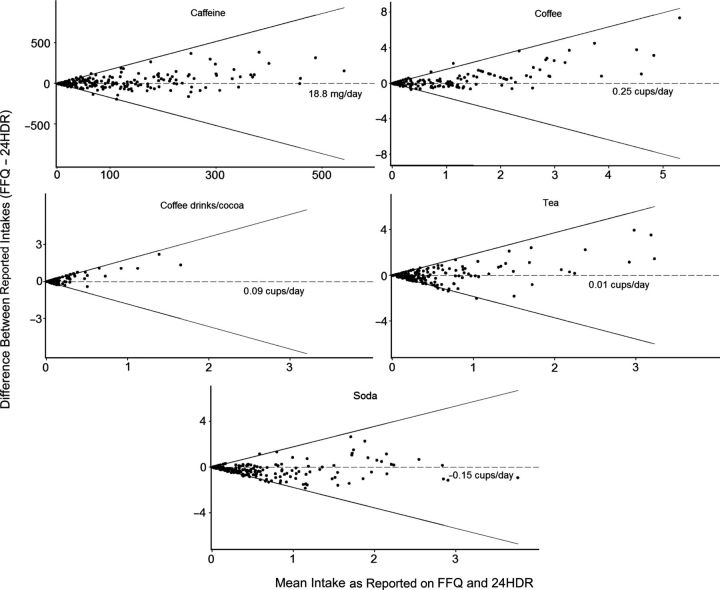
Figure 1.
Bland-Altman plots of difference in caffeine (mg/day) and beverage (cups/day) intakes between the food frequency questionnaire (FFQ) and the 24-hour dietary recall (24HDR) in the BioCycle Study, 2005–2007. The dotted line in each graph represents the mean difference between the FFQ and the 24HDR on the original scale; solid lines represent relative limits of agreement on the logarithmic scale. One cup = 237 mL. Coffee includes all types but “not lattes or mochas.” Coffee drinks/cocoa includes “latte, cappuccino, mocha, or hot chocolate.”

