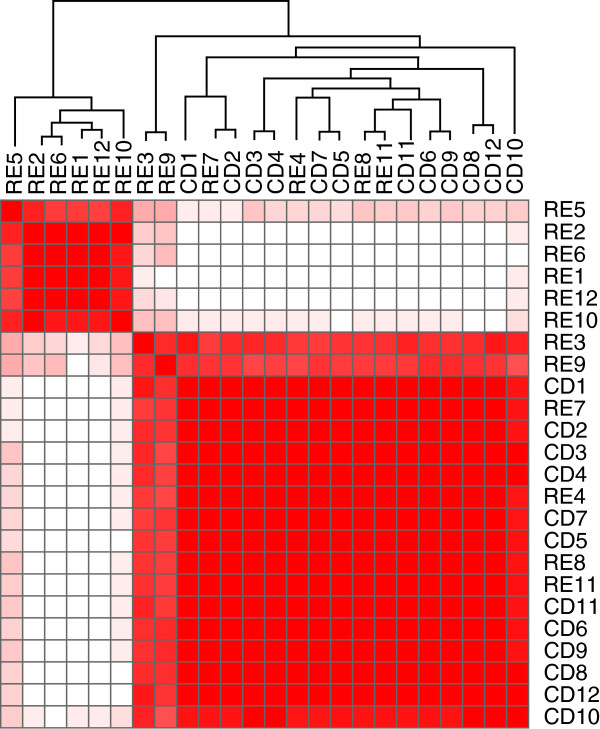
Figure 2.
Consensus clustering applied to qPCR array expression data from Rasmussen encephalitis (RE) and cortical dysplasia (CD) specimens. Non-negative matrix factorization was used to determine whether the mRNA expression data could distinguish between RE and CD. With k = 2 clusters, six of the RE cohort were clearly predicted. Two RE cases partially segregated, and the remaining four could not be differentiated from the CD cohort. Heat map is scaled from high (red) to low (white) correlation between samples.

