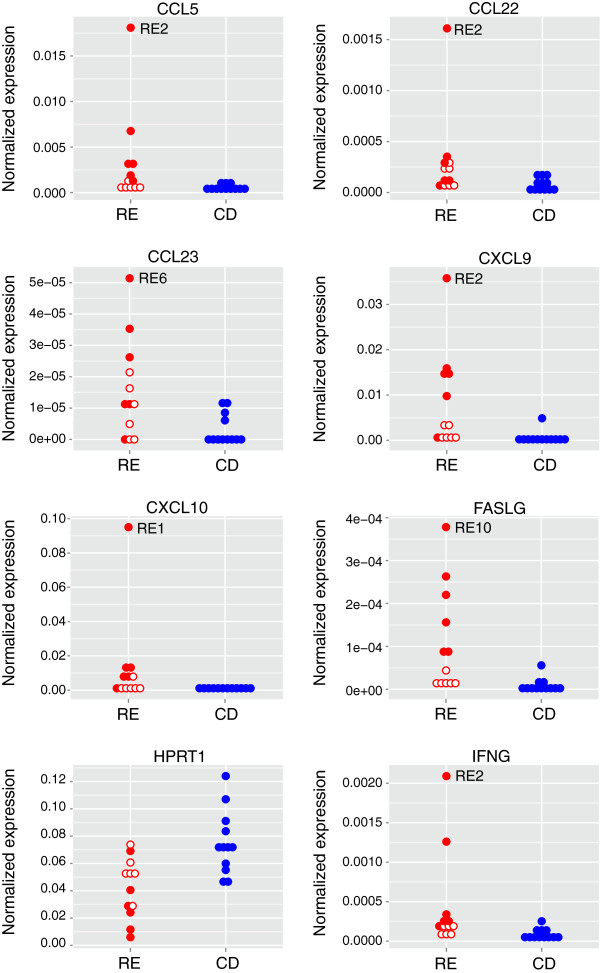
Figure 3.
Expression levels of genes that were significantly different between Rasmussen encephalitis (RE) and cortical dysplasia specimens. Stacked dot plots of normalized expression values for each sample are shown. Solid circles identify the six RE specimens separable by consensus clustering (Figure 2); open circles identify the remaining RE cases. The RE sample with the highest inflammatory gene transcript level is indicated.

