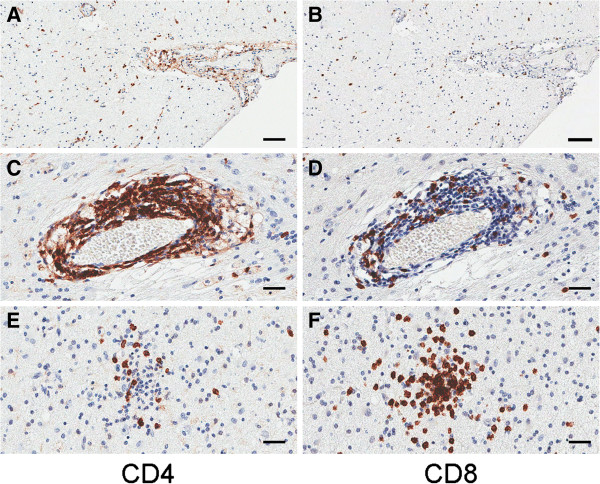
Figure 7.
Photomicrographs showing CD4+ and CD8+ immunoreactivity in Rasmussen encephalitis (RE) specimens. Adjacent sections from specimens expressing high chemokine mRNA levels show a greater concentration of CD4+ T cells than CD8+ T cells within leptomeninges (A and B) and perivascular spaces (C and D), and fewer CD4+ T cells (E) within clusters of CD8+ T cells in brain parenchyma (F). Images are taken from specimens RE2 (A and B), and RE10 (C-F). Scale bars correspond to 50 microns (A and B), and 25 microns (C-F).

