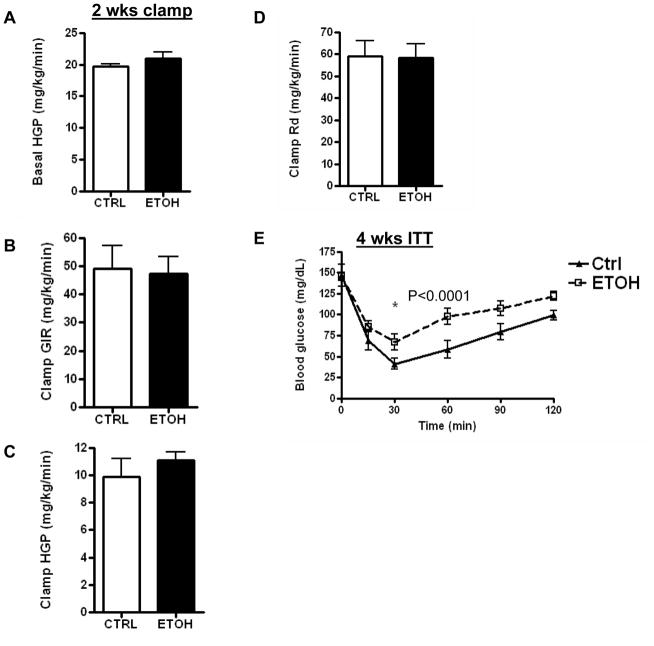
Fig. 4. Effects of control or ethanol diets on insulin sensitivity as measured by hyperinsulinemic-euglycemic clamp at two weeks, and insulin tolerance test at four weeks.
(A) Basal hepatic glucose production (HGP); (B) clamp glucose infusion rate (GIR); (C) clamp HGP; (D) rate of glucose disposal (Rd); (E) insulin tolerance test (ITT) at 4 weeks. Data are means ± SEM; N=5. *P<0.05 is significant. For Fig. 4E ANOVA: Treatment and Time P<0.0001. CTRL=Control-fed; ETOH= ethanol-fed.

