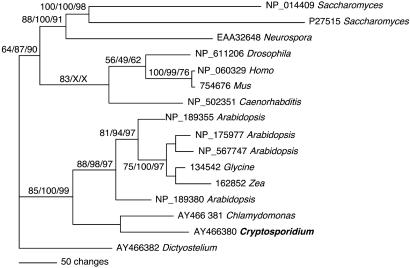
Fig. 2.
C. parvum harbors a UK-UPRT with similarity to plant and algal UK-UPRT. The tree shown is the single most parsimonious tree. Numbers above the branches indicate the bootstrap values for parsimony and neighbor-joining analyses followed by maximum likelihood puzzle frequencies. Only values >50% are shown. If a given method did not provide significant support for the relationship indicated, an “X” has been inserted. The scale is as indicated. GenBank and TIGR EGO accession numbers are as listed. See Materials and Methods and supporting information for details on alignment and analysis.

