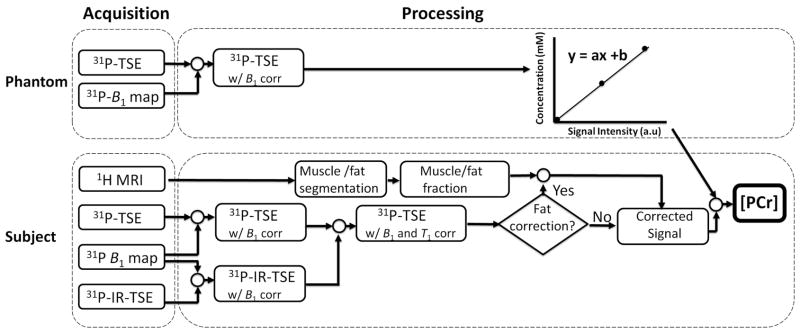
Fig. 1.

Flow chart of the data acquisition, image reconstruction and quantification processes for measuring PCr concentration in muscles of the lower leg. Inorganic phosphate phantoms are used to derive a calibration curve of PCr concentration as a function of signal intensity (top). Imaging of phantomes is performed under fully relaxed conditions (TR = 60 s), and therefore there is no T1 correction step in the processing. In-vivo PCr images (bottom) are corrected (B1, T1) and compared voxelwise against the calibration curve. In cases where significant fat infiltration is present in the muscles, 1H images can be used to estimate the fraction of fat/muscle in the tissue.
