
Figure 2.
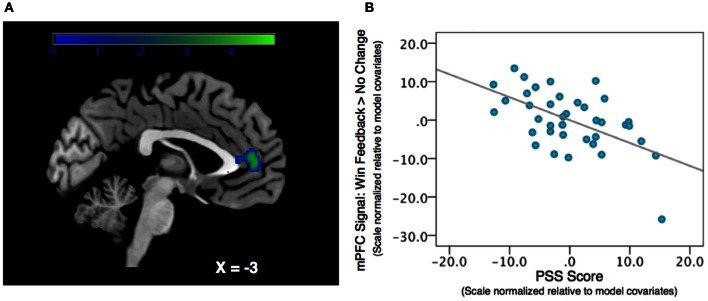
Association between Perceived Stress and mPFC BOLD signal during a contrast of Win Feedback > No Change Feedback. (A) SPM depicting mPFC cluster. Cluster is significant after correcting for multiple-comparisons using a cluster-extent correction procedure pcluster = 0.023. Color-bar indicates t-statistic. (B) Partial regression plot, which normalizes variables relative to model-covariates, depicting the relationship between perceived stress and mPFC BOLD response during Win Feedback > No Change Feedback. NB: the effect is still significant when the potentially influential data point in the bottom right corner of the graph is removed.