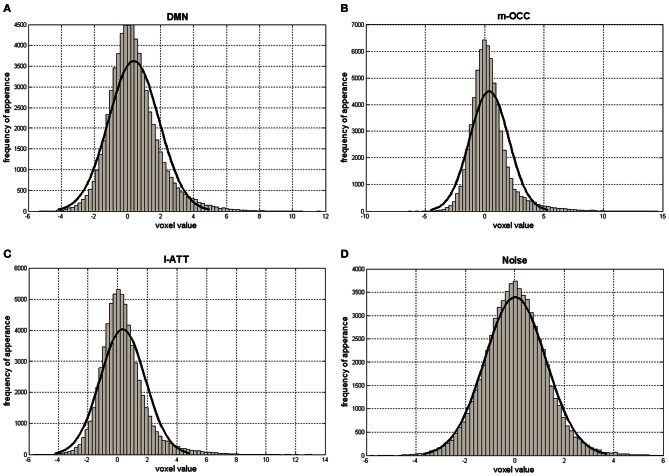
Figure 3.
Histograms of S matrix rows related to the default-mode network (DMN) (A); the occipital network, the medial visual cortical areas (m-OCC) (B); the attention network, the left lateralized frontoparietal attention networks (l-ATT) (C); and a noisy IC (D). The x-axis ranges from negative to positive values. The solid black line represents a Gaussian fit.

