
Figure 4.
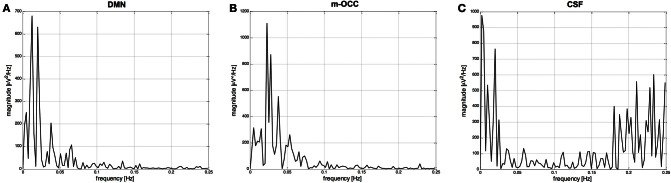
(A) and (B) Power spectral densities (μV2/Hz) of two IC time courses selected by the algorithm: the default-mode network (DMN) and occipital network, the medial visual cortical areas (m-OCC), after clustering and segmentation. (C) Power spectral density of an IC time course related to cerebrospinal fluid (CSF) and rejected by the spectral analysis.