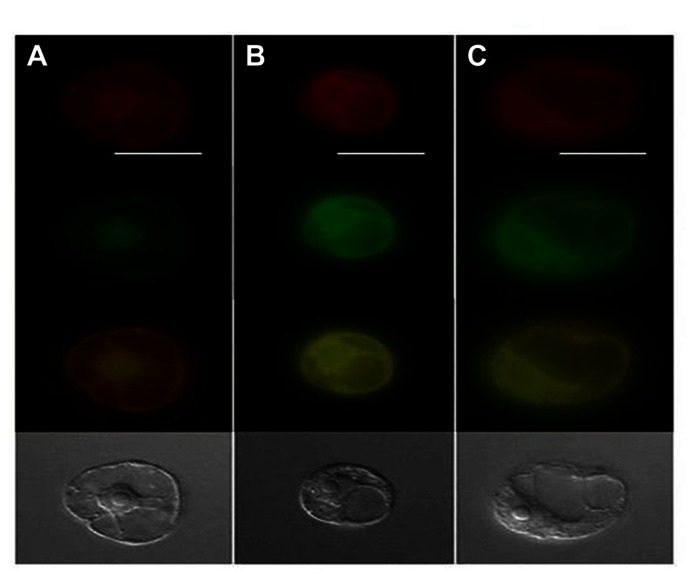
FIGURE 3.
Epifluorescence microscopy of endoplasmic reticulum (ER) and GFP localization where ER (red) on top panel, GFP (green) in second panel, merged green/red in third panel and the bottom panel displays the transmitted light images. Panel (A) shows TMV 30B-GFPc3 (GFPc3 is GFP where ER localization signal have been removed) inoculated cells while (B) shows cells that were inoculated with TMV GFP:P34, and (C) is cells inoculated with TMV P34:GFP. Image from Wang et al. (2010) with permission.

