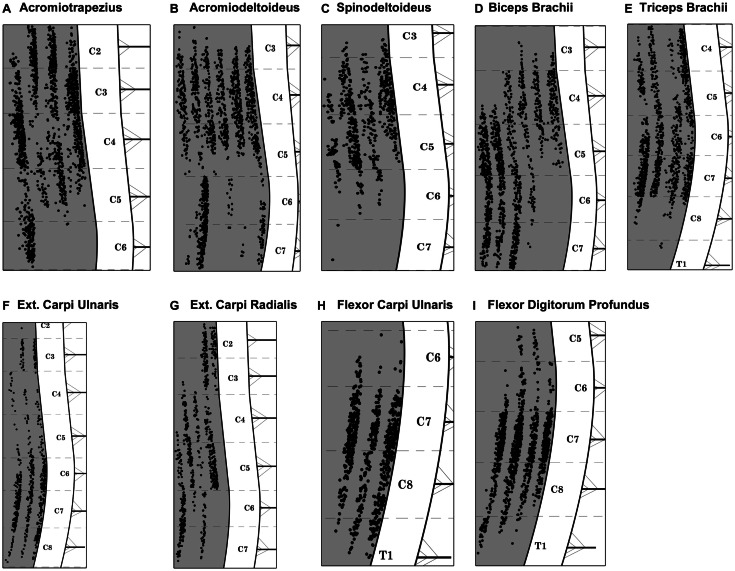
Figure 3.
Composite diagram illustrating the distribution of labeled motor neurons from each targeted muscle. Each black dot represents one labeled motor neuron and each columnar-shaped data set represents the FG-labeling observed after intramuscular injections in one muscle. (A) Acromiotrapezius, (B) acromiodeltoideus, (C) spinodeltoideus, (D) biceps brachii, (E) triceps brachii, (F) extensor carpi ulnaris, (G) extensor carpi radialis, (H) flexor carpi ulnaris, and (I) flexor digitorum profundus. Spinal cord levels are indicated in the white matter on the right hand side of each diagram. Each cervical/thoracic spinal cord segment is demarcated by dashed lines. These lines correspond to the halfway point between two nerve roots.

