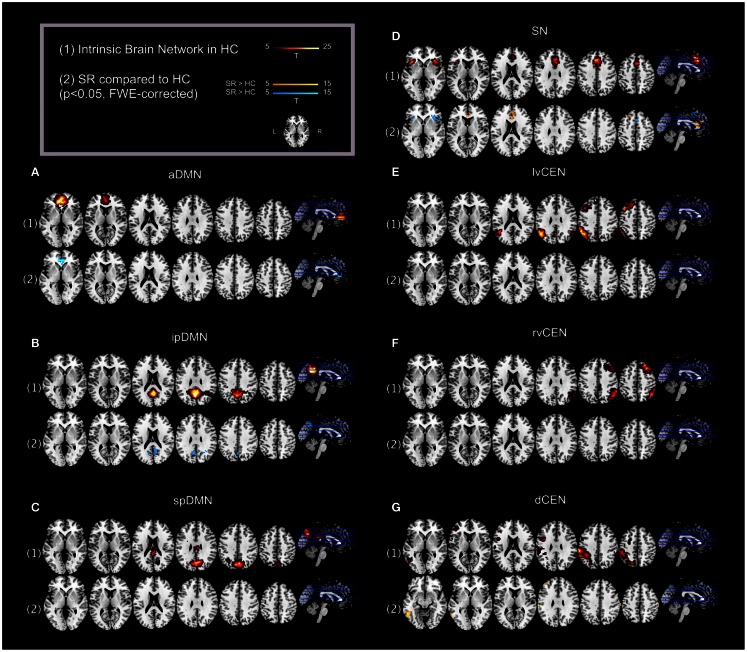
Figure 2.
Default mode network, salience network, and central executive network in healthy controls (HCs) and corresponding group differences for patients with schizophrenia in state of remission. (1) Spatial maps of selected ICs representing the default mode, salience, and central executive network (DMN, SN, CEN) in HCs were entered into voxel-wise one-sample t-tests and thresholded at p < 0.05, corrected for family-wise error (FWE). Statistical parametric maps (SPMs) representing brain areas with significantly co-varying activity were superimposed on a single-subject high resolution T1 image (color scale representing t-values from 5 to 25; only maps of HCs are shown). (2) To analyze between-group differences, patients’ and controls’ ICs of the DMN, SN, and CEN were entered into voxel-wise two-sample-t-test with age, sex, and total GM volume as covariates of no interest and thresholded at p < 0.05, FWE-corrected. SPMs were superimposed on a single-subject high resolution T1 image (color scale representing t-values from 5 to 15; yellow (“hot”) color maps indicate regions displaying higher intra-iFC in SR compared to HC; blue (“cold”) color maps indicate regions displaying less intra-iFC in SR compared to HC). Results for each network of interest are presented panel-wise: (A) anterior default mode network (aDMN); (B) inferior-posterior default mode network (ipDMN); (C) superior-posterior default-mode network; (D) salience network (SN); (E) left-ventral central executive network (lvCEN); (F) right-ventral central executive network (rvCEN); (G) dorsal central executive network (dCEN). SR, group of patients with schizophrenia during remission; HC, healthy control group (see also Tables 3 and 4).

