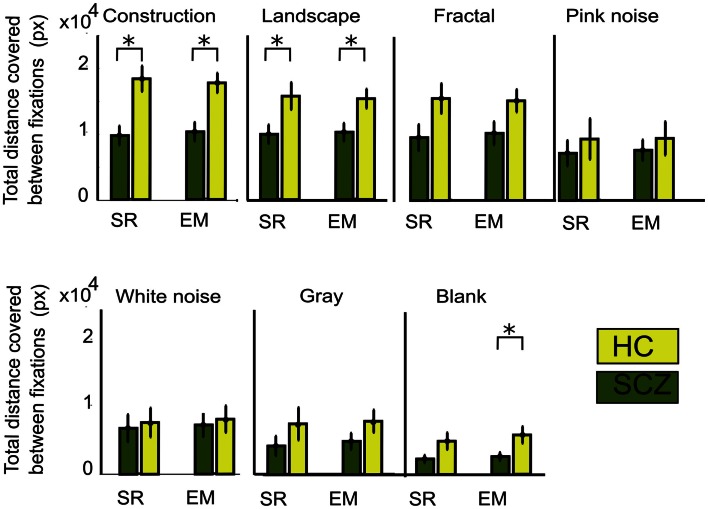
Figure 3.
Total Euclidean distance for different image category. The measure for visual exploration adds the minimal distances between fixation locations (see Materials and Methods) measured with the SR and EM algorithms. The total average distance for each subject is shown for each image category. In both groups of subjects, the amount of distance decreases with image complexity, independent of the algorithm used. SCZ patients showed significantly reduced visual exploration. The EM algorithm still shows significant differences for constructions, landscapes, and blank images. Error bars indicate SEM (*p < 0.05 or less, for two-sample t-test).

