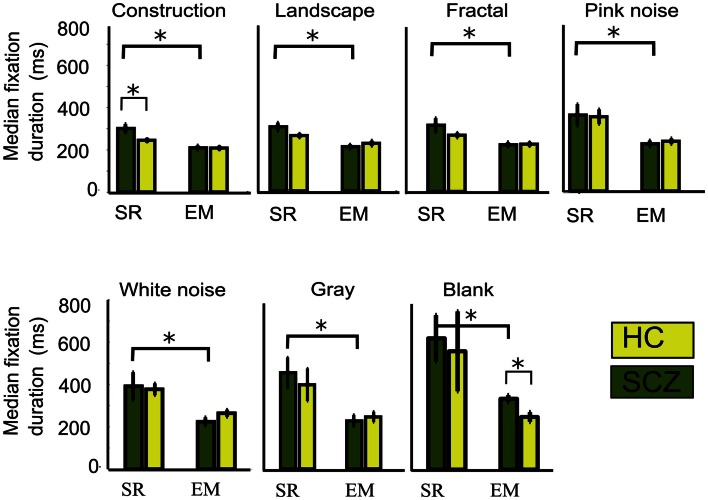
Figure 7.
Median fixations duration for different image category. We plotted the median fixation duration for each experimental group while viewing every image category. Here, only significant differences for the SCZ and HC groups are found for the constructions images when the SR algorithm is employed. When SR is compared with EM, significant differences are found for all image categories in SCZ, but only presentation of blank images elicited significant differences between SCZ and HC groups under EM algorithm. Error bars indicate SEM (*p < 0.05 or less, for two-sample t-test).

