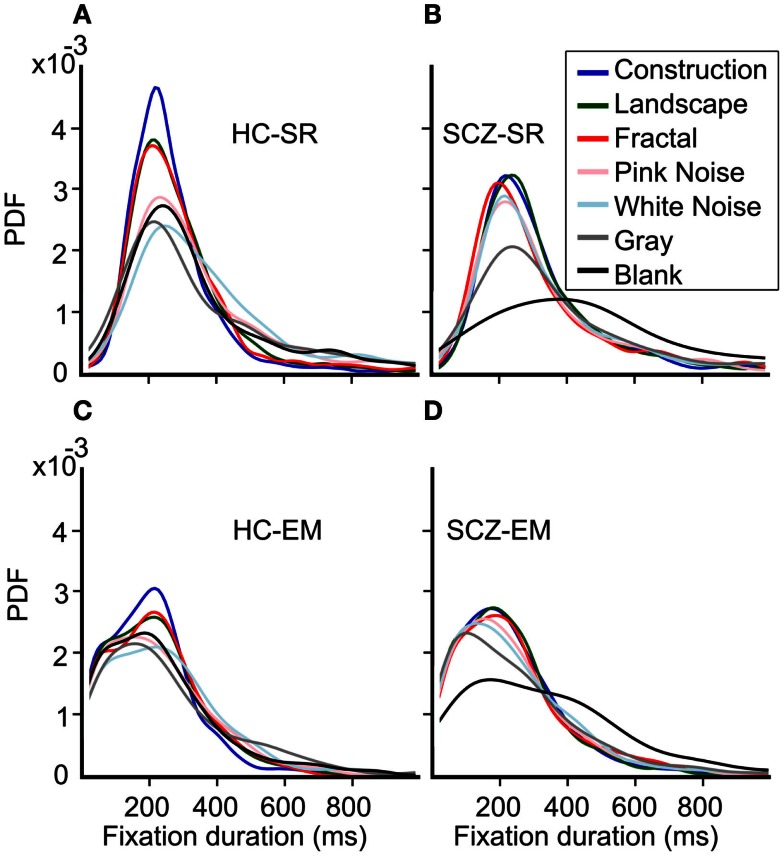
Figure 8.
Probability density function (PDF) for fixation durations for each image category. (A–D) These plots are a smoothed representation of the binned histograms. HC subjects show a narrower distribution for fixation durations using the SR algorithm for image categories with the largest complexity. The distribution for construction was significantly different from all others; landscapes and fractals were similar but different to the other categories which were similar to each other (Kolmogorov–Smirnov, p = 0.05). When we employed the EM algorithm, we found that the mode of their distribution changes slightly, with a largest proportion of the fixation duration seen for durations below 200 ms. However, statistical differences between these curves remain identical to those observed for the SR algorithm.

