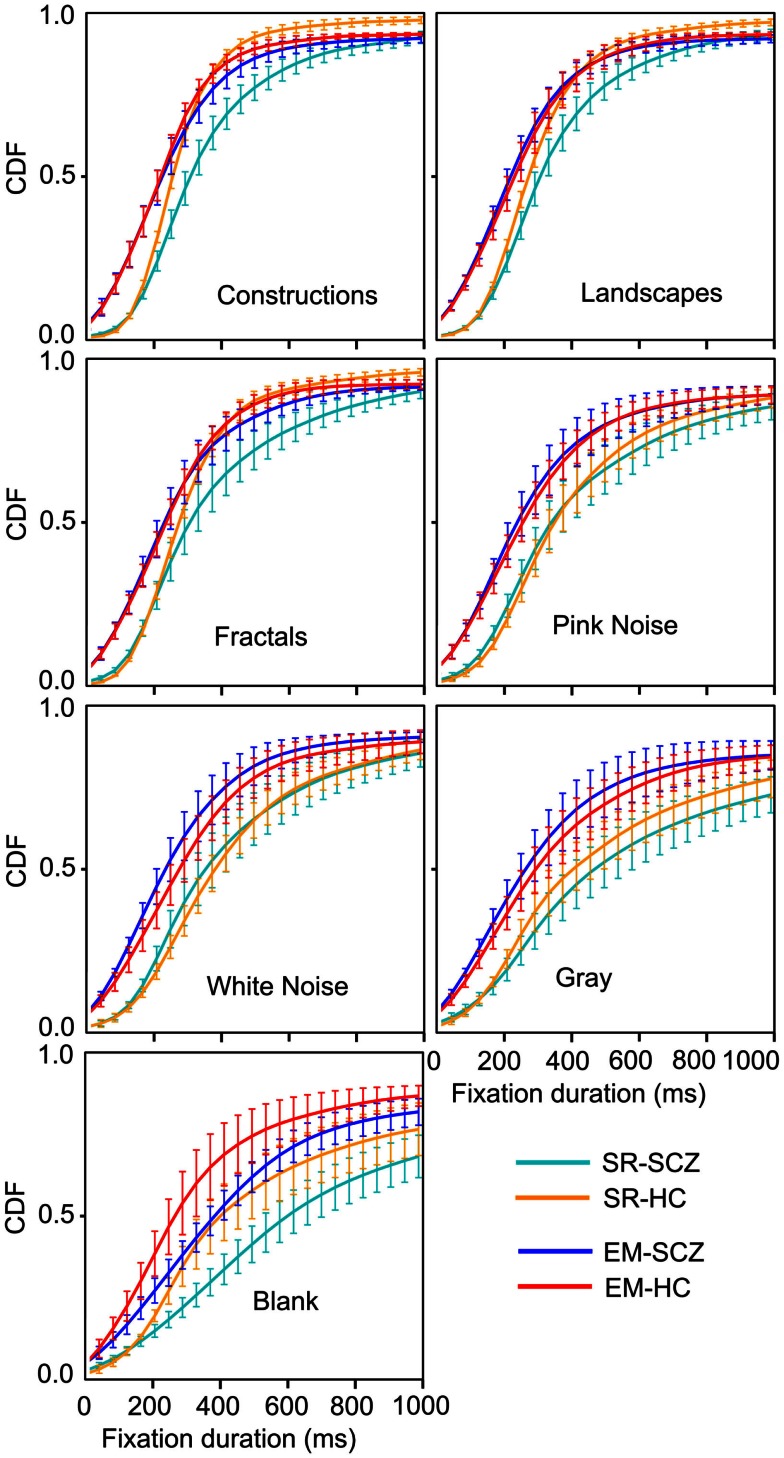
Figure 9.
Cumulative density function (CDF) for fixation durations for each image category. These graphs show the shift in fraction fixation with short and large duration. The brackets depict the 95% confidence interval for each fixations duration bin. Employing the EM algorithm resulted in a left-shift of the distribution, both for the HC and SCZ subjects. Moreover, differences between these groups that were observed for images with high complexity were no longer significant when the EM algorithm was employed. Nevertheless, blank images still show significant differences in the distribution of fixation duration between SCZ and HC groups.

