Figure 1. Coherent GISAXS: from direct space to Fourier space.
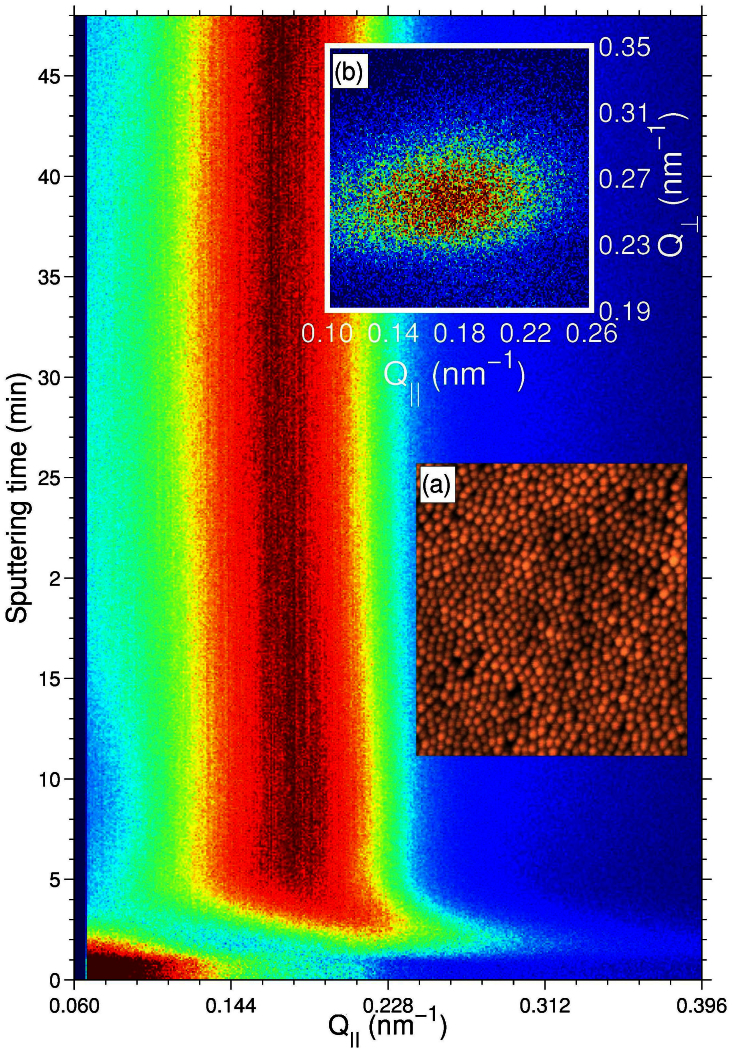
GISAXS - time map for a GaSb surface eroded at 500 eV. The onset of a self-organized pattern is evidenced by the appearance of the correlation peak at t ~ 1 min (see text for details). Inset images: (a) Atomic force microscopy image (1 × 1 μm2 area) of a GaSb sample sputtered at normal incidence. (b) The speckled correlation peak at t = 47 min.

