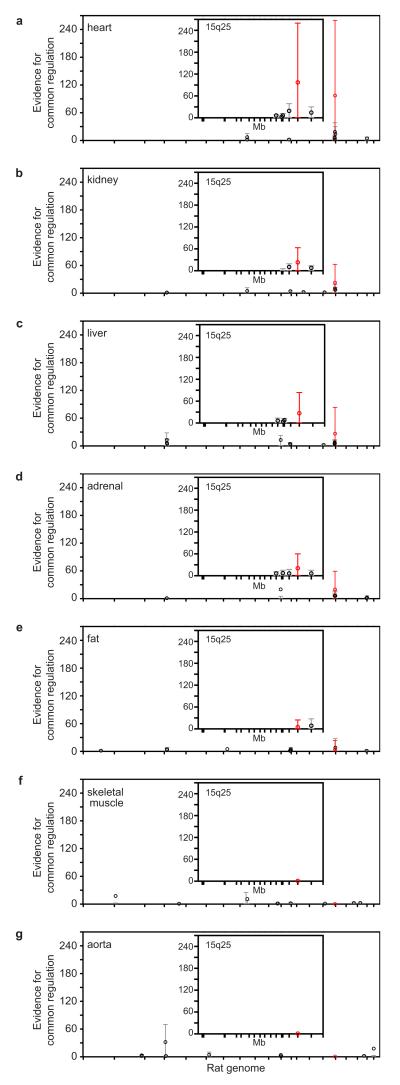
Figure 2. Genetic mapping of regulatory ‘hot-spots’ for the iDIN.
a-g, For each rat autosomal chromosome (x-axes), the strength of evidence for a SNP being a regulatory ‘hot-spot’ for controlling the network is measured by the average Bayes Factor (y-axes). Controlling the FDR at 1% level for each eQTL, the average Bayes Factor indicates the evidence in favour of common genetic regulation versus no genetic control, and is reported as a ratio between the strengths of these models (Supplementary Information). For the 10 largest regulatory hot-spots the average Bayes Factors (circles) and their 90% range (5th-95th percentiles) are reported; a single SNP (J666808) that is consistently and most strongly associated with the network in 5 out of 7 tissues is highlighted in red. Inserts, average Bayes Factors and 90% range for the SNPs on rat chromosome 15q25 (87,479,238 - 108,949,015 bp). SNP positions in the region are indicated by tick marks.

