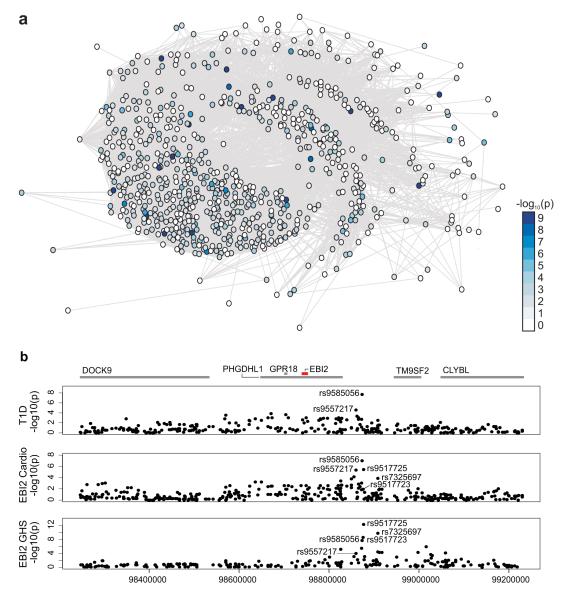
Figure 3. A gene network and locus for T1D risk.
a, Schematic representation of the union of IRF7-driven gene networks that was created using the set of human orthologues of rat iDIN genes and human iDIN genes. A Wilcoxon rank test based gene set enrichment analysis (modified from Holden et al.)30 showed SNPs close to iDIN genes to be significantly more likely to associate with T1D in large-scale GWAS than SNPs close to randomly selected genes (P = 2.5 × 10⁻¹⁰) and randomly selected immune response genes (P = 8.8 × 10⁻⁶). Nodes represent iDIN genes and the node colour indicates the P-values (-log10 scale) of the association with T1D (see Methods). b, Results of EBI2 eQTL analysis in GHS (top panel), Cardiogenics (middle panel) and T1D association (bottom panel) at the human chromosome 13 locus that is orthologous to the 700kb rat chromosome 15q25 region. The upper panel shows the nominal –log10 P-values of marker regression against gene expression of EBI2 for all SNPs in the region. We defined EBI2 eQTL models by selecting SNPs using lasso regression (Supplementary Information) in GHS (rs9585056, rs9517723, rs7325697). When adding imputed SNPs, rs9517725 explains most of the variation of the EBI2 expression (P = 6.8 × 10⁻¹³) at this locus. Lasso model selection in Cardiogenics yielded an overlapping set of three SNPs (rs9557217, rs9585056, rs9517725). The lower panel shows the –log10 P-values of T1D association with SNPs in the region. SNP rs9585056 showed the strongest association with T1D (P = 7.0 × 10⁻¹⁰) amongst the genotyped markers.

