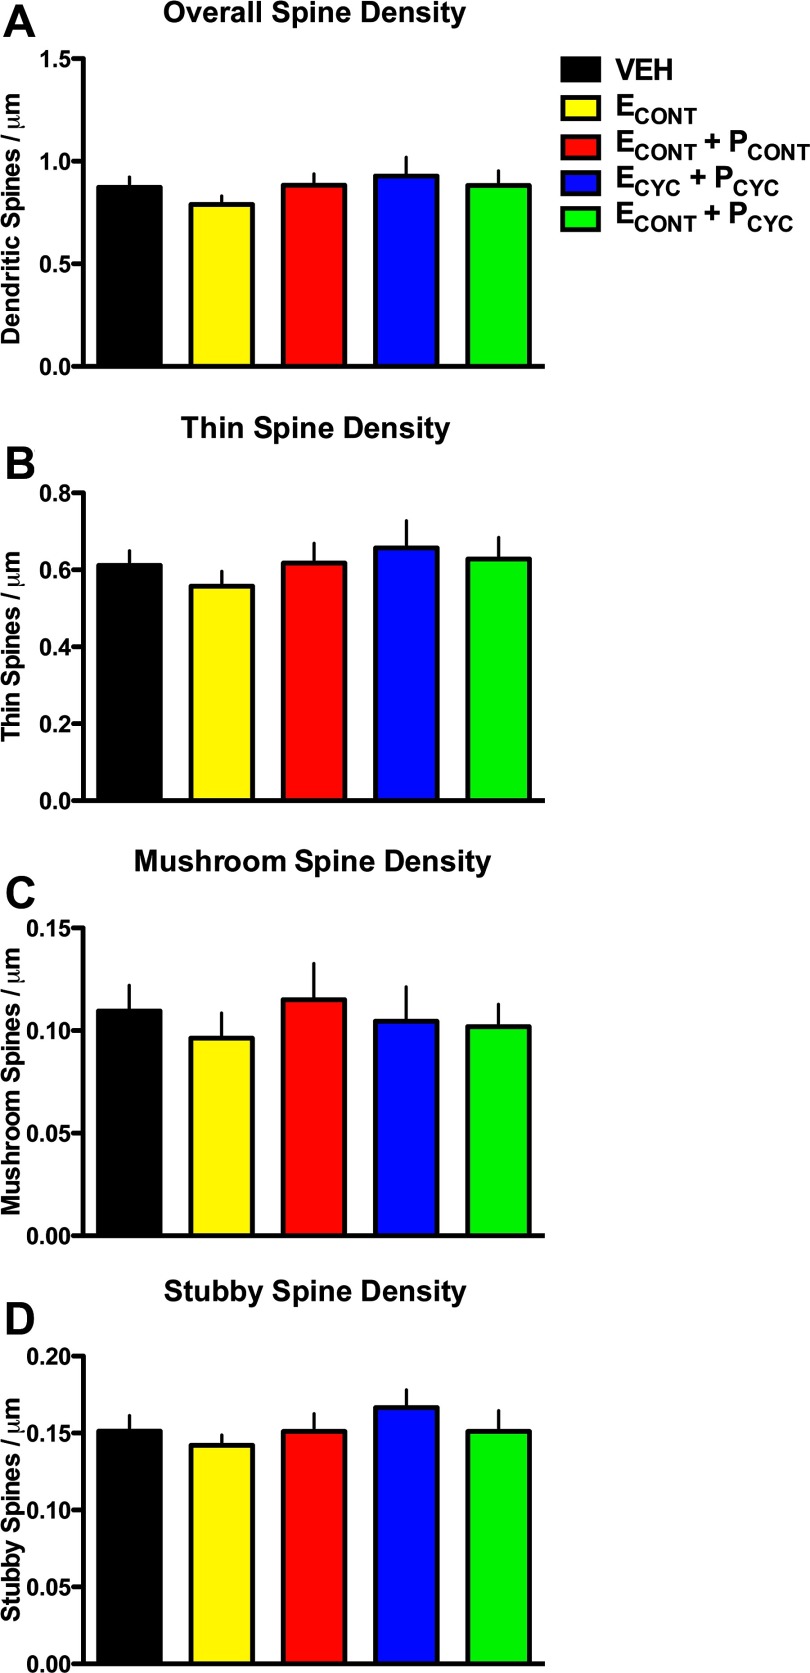
Figure 3.
HT and dendritic spine density. A, Overall dendritic spine density on aged monkey dlPFC neurons. ANOVA found no significant differences in overall spine density between groups. B–D, Spine densities divided by spine types: thin (B), mushroom (C), and stubby (D). ANOVA found no main effect on condition for any spine type density. See Results for details.

