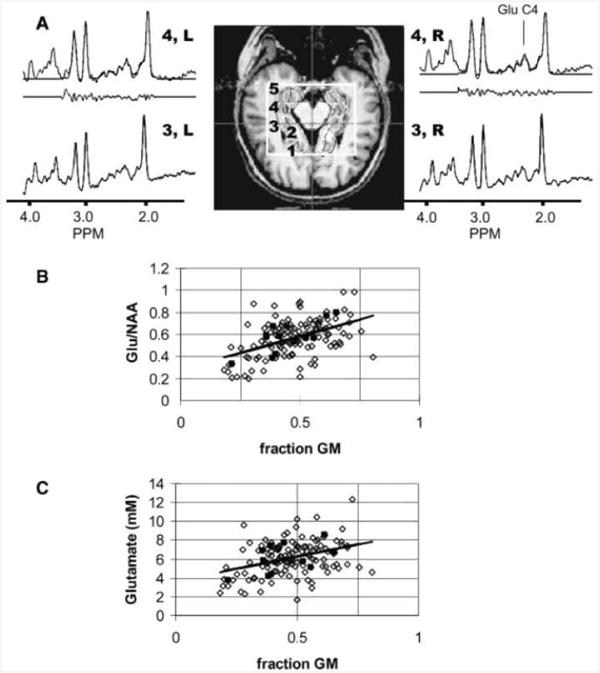
Figure 3.

(A) Hippocampal scout, definition of loci 1–5 (loci 2–4 including hippocampal tissue) and indicated spectra from a healthy control. The outlined box indicates the large voxel selection. The loci were consistently determined after manual definition of the midbrain aqueduct (indicated by crosshairs) and the hippocampi. For the loci 4L and 4R, the spectral analysis is shown with the fitted, original spectra and residual. The position of glutamate (2.35 ppm) is indicated in the spectra. Regression plots of glutamate:NAA (B) and glutamate concentration (C) with fraction of gray matter from the hippocampal and temporal region. The solid symbols are data from a single volunteer (same volunteer in both ratio and concentration plots).
