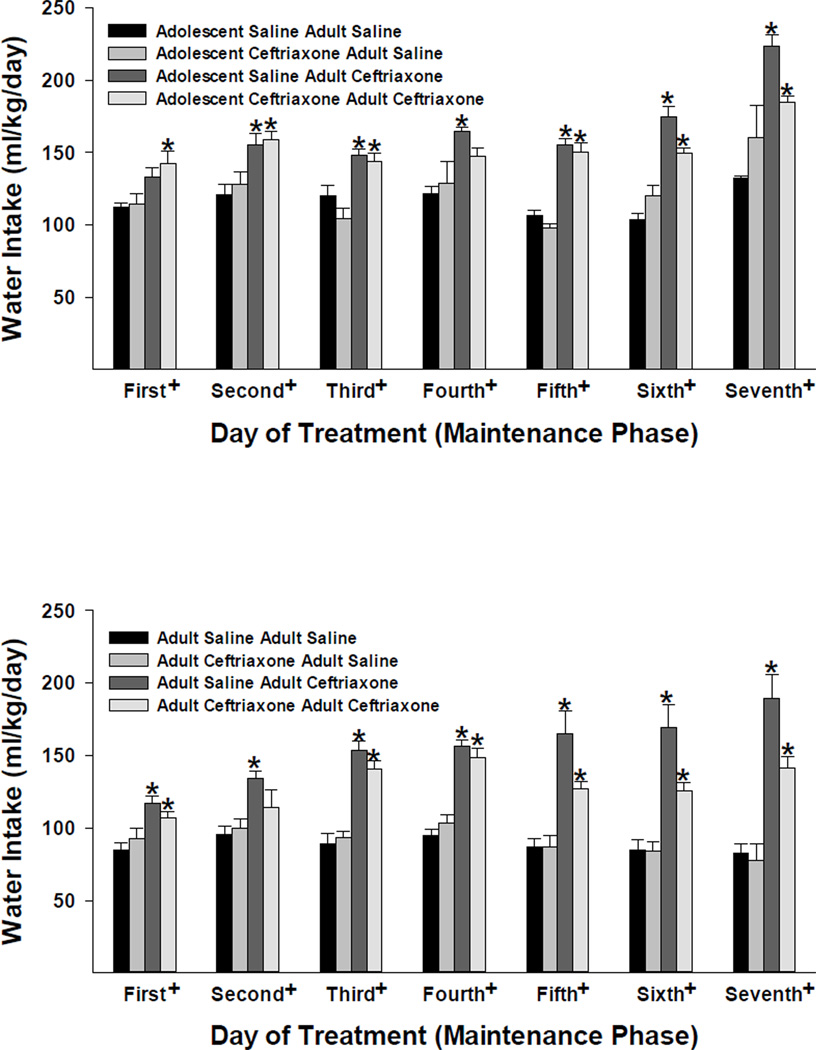
Figure 3.
The effects of ceftriaxone (200 mg/kg) on average (± S.E.M.) water intake (ml/kg/day) for adolescent and adult female P rats during the maintenance of ethanol-drinking test (seven consecutive days). Four groups of animals from each age (adolescence in the top panel and adulthood in the bottom panel) at onset of ethanol-drinking behavior are depicted. The two bars on the left, for each respective test day, indicate data from animals that received saline during the maintenance test, whereas the two bars on the right indicate data from animals that received ceftriaxone during the maintenance test. +, indicates a significant (p < 0.05) main effect of treatment (four groups) for that respective test day. *, indicates a significant (p < 0.05) difference between the respective group and the saline-saline control group (Dunnett’s t-test).

