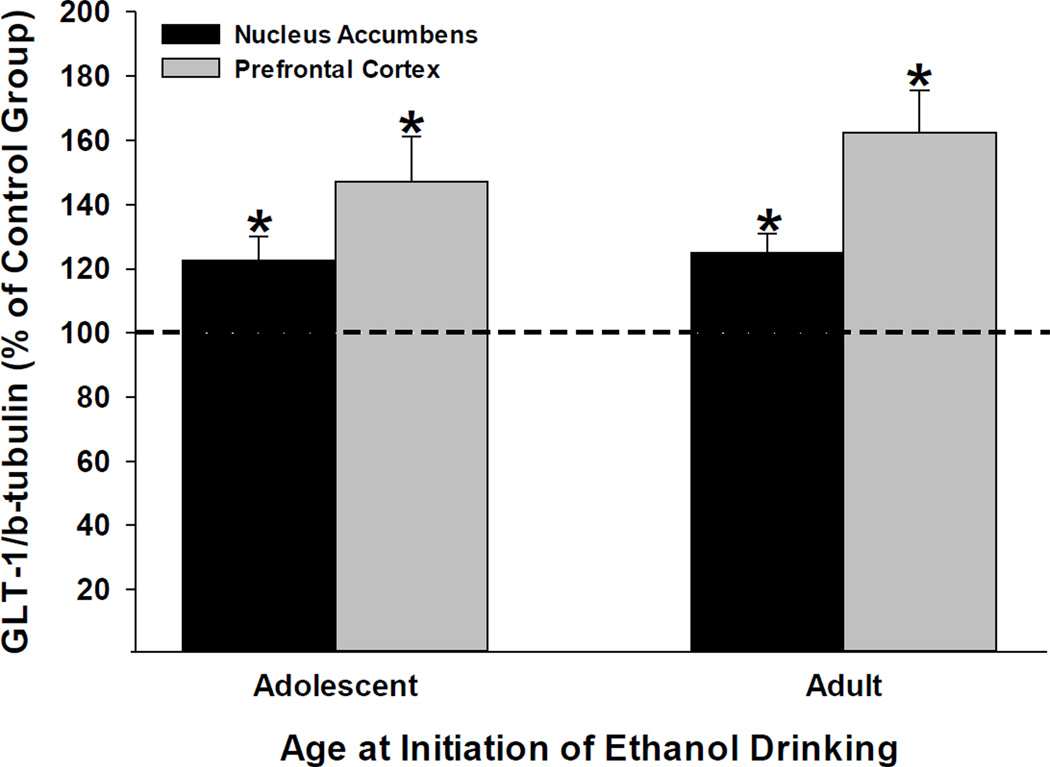
Figure 4.
Effects of ceftriaxone on average (± S.E.M.) GLT1 protein expression levels [GLT1/β-tubulin (% of Control Group)] within the nucleus accumbens (left bar) and prefrontal cortex (right bar) from brains harvested seven days after the maintenance test-phase of the experiment was completed. Animals that initiated ethanol intake during adolescence are depicted on the left, whereas animals that initiated ethanol intake during adulthood are depicted on the right. Both the ceftriaxone group (n = 4) and the control group (n = 4) received saline prior to the acquisition of ethanol intake phase of the experiment. *, indicates a significant (p < 0.01) difference between the ceftriaxone-treated group and the 100% control-value (single-sample t-tests). Ceftriaxone induced a significant up-regulation of GLT1 protein expression levels in both the nucleus accumbens and prefrontal cortex regardless of when the animals initiated ethanol drinking.

