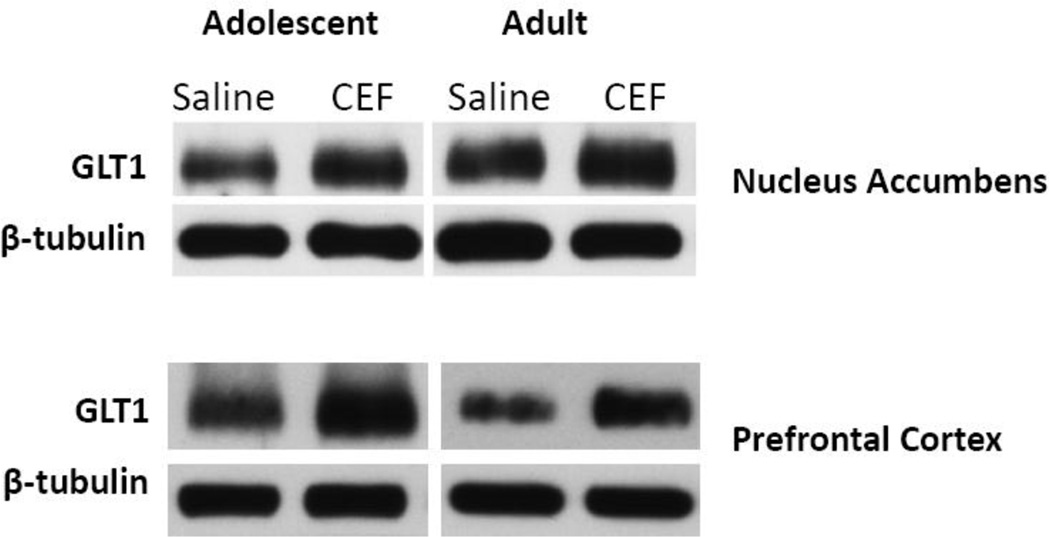
Figure 5.
Effects of ceftriaxone [VEH-CEF] (200 mg/kg, on the right) vs. saline [VEH-VEH] (on the left) on protein expression levels of GLT1 and β-tubulin within the nucleus accumbens (top panel) and prefrontal cortex (bottom panel). Data from animals that initiated ethanol drinking during adolescence are depicted on the left, whereas data from animals that initiated ethanol drinking during adulthood are depicted on the right. Visual and statistical analyses (p’s > 0.5) revealed that β-tubulin levels did not differ between any of the groups.

