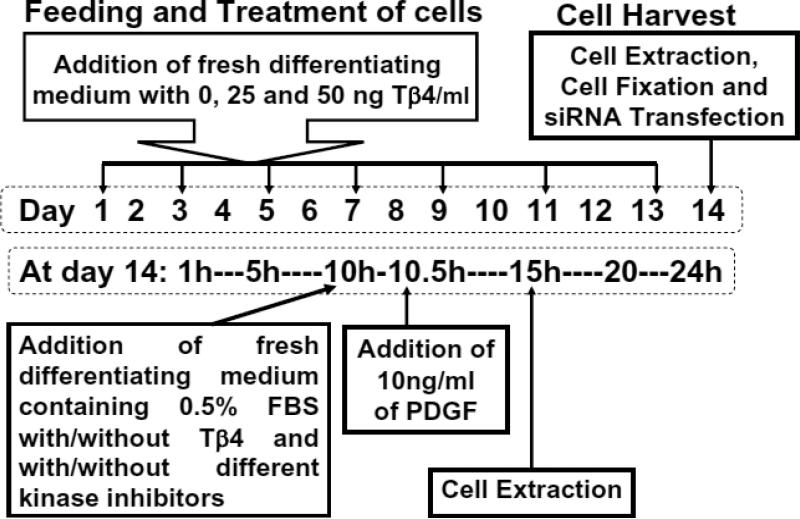
Fig. 1. Schematic diagram of experimental manipulation.
Rat SVZ cells and mouse N20.1 cells were fed with their differentiating medium and treated with 0, 25 and 50 ng/ml of Tβ4 (top box at left). These cells were fed and treated every two days indicated by arrows for 14 days (dotted rectangle box at center). On day 14, these cells were harvested indicated by an arrow as cell extraction for preparation of total RNA and proteins, cell fixation for immunostaining and siRNA transfection for Tβ4 silencing in these cells after the treatment with Tβ4 (top box at right). To determine the effect of kinase inhibitors and PDGF on these cells, the medium was changed with differentiating medium containing reduced FBS (0.5%) along with and without Tβ4 and different kinase inhibitors (rectangle box at left) on day 14 at hour 10 (10AM). After 30min, these cells were treated with 10ng PDGF/ml. These cells were incubated for additional 4.5h and then subjected to preparation of cell extracts for total RNA and proteins at hour 15 (3PM).

