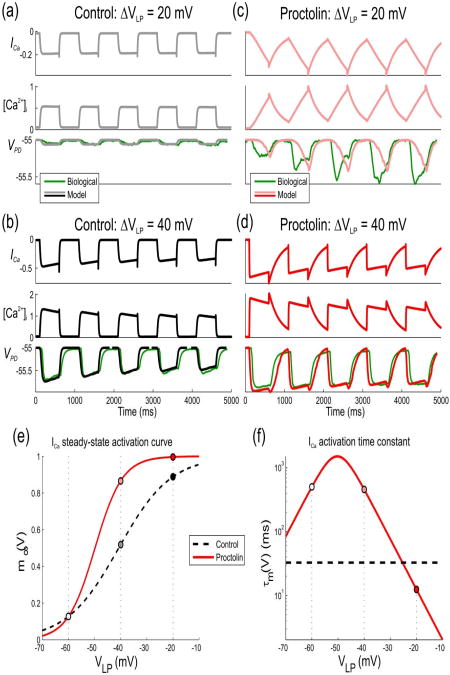
Figure 3. Effects of proctolin in model I on LP to PD synaptic transmission for a sample parameter set.
The response of the model with the parameter set shown in red in Fig. 2(a) to trains of low- and high-amplitude pulses in control and proctolin is compared to a biological recording (green traces) of the IPSPs in the PD neuron in one experiment different than the one shown in Fig. 1(a)). (a) The model response to low-amplitude (20 mV) pulses in the presynaptic LP neuron in control shows no significant IPSP in the PD neuron. (b) The model response to high-amplitude (40 mV) presynaptic pulses shows synaptic depression in control. (c) A switch to synaptic facilitation by proctolin. Proctolin changes the steady-state activation and time constant of ICa which leads to a gradually-increasing IPSP in the PD neuron due to the gradual increase of [Ca2+]i in presynaptic terminal. (d) Although Ca2+ entry is enhanced with high-amplitude voltage pulses in proctolin, a change in the activation kinetics results in synaptic depression. (e) Steady-state activation of ICa in control and in proctolin. Proctolin shifts the activation curve to the left and changes its slope, which leads to enhanced synaptic strength of the LP to PD synapse in the biological range. (f) Activation time constant of ICa in control and in proctolin. Parameter values are: KCa = 1.17μM, ḡsyn = 6.06nS / μM4, ḡCa = 8.09nS, gm = 0.416μS, τh = 2.08s, τCa = 18.4ms, , Vh = 19.1mV, Sh = 4.56mV, Vm = 40.8mV, Sm = 10mV,

