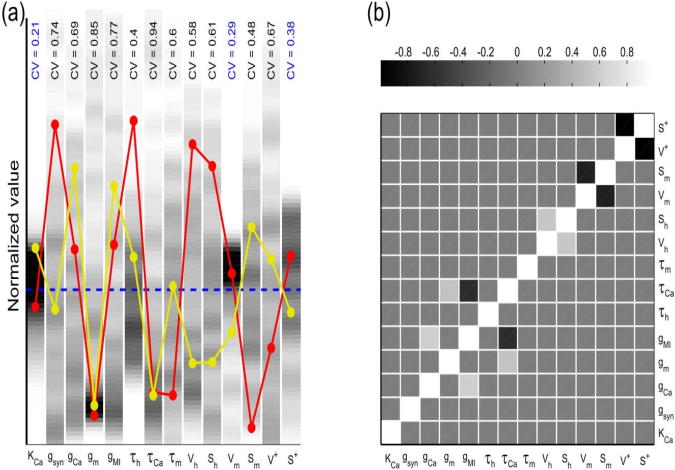
Figure 5. Optimized parameter sets showing the modulation of MI channels by proctolin in model II.
A total of 198 randomly-seeded parameter sets were optimized for model II to fit the experimental recording of the synaptic outputs in control and proctolin for two different presynaptic voltage amplitudes (see Methods). (a) The distribution of parameter values for 14 of 15 parameters in model II. (In all parameter sets K− converged to a value very close to the lower limit of 0.1 s−1 during optimization, and is not shown.) The value of each parameter was normalized to the mean value of its distribution (dashed blue line) for comparison; these mean values are: KCa = 1.9μM, ḡsyn = 5.1nS / μM4, ḡCa = 29.4nS, gm = 34.8nS, gMI = 2.06nS, τh = 587ms, τCa = 26.5ms, τm = 41.8ms, Vh = 61.6mV, Sh = 27.7mV, Vm = 36.8mV, Sm = 14.1mV, V+ = 14.7mV, S+ = 3.61mV. Two parameter sets are also shown for comparison (red and yellow), demonstrating that good fits to the data did not require a consistent relationship among all parameters. Three out of the 14 parameters were relatively tightly constrained by the optimization technique (coefficient of variation < 0.4 shown in blue). (b) Pair-wise correlations among the best-fit parameters indicate that few parameter pairs showed any significant (R > 0.5) co-variation.

