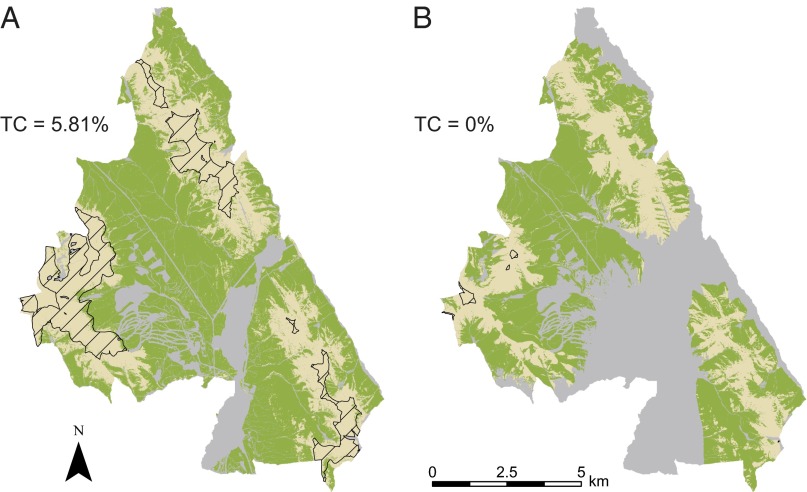
Fig. 3.
Hatched area indicates area with summer (June to August) average temperature ranging from 5.5 °C to 7.5 °C, typically reported in the literature to be the temperature-based, tree-growth limit zone (9): based on temperature normals for the period 1971–2000 (A); based on predicted temperature normals for the period 2041–2070 (climate model CRCM nested within CGCM3, A2 SRES scenario; Materials and Methods and Text S2) (B). Green, observed (A) and projected (B) treed area; beige, nontreed area; gray, area not used in the study, corresponding to human infrastructures, channels, and lower valley alluvial floodplains (in A) plus the area for which 2041–2070 climatic data falls outside the range of variability of the model training data (1971–2000 climate) and, thus, not used in the projection (in B). TC, percentage of tree-covered area in the temperature-based, tree-growth limit zone. Note the low overall tree cover within the temperature-based, tree-growth limit zone, being lowest in the future scenario. (Resolution of the maps: 10 m.)

