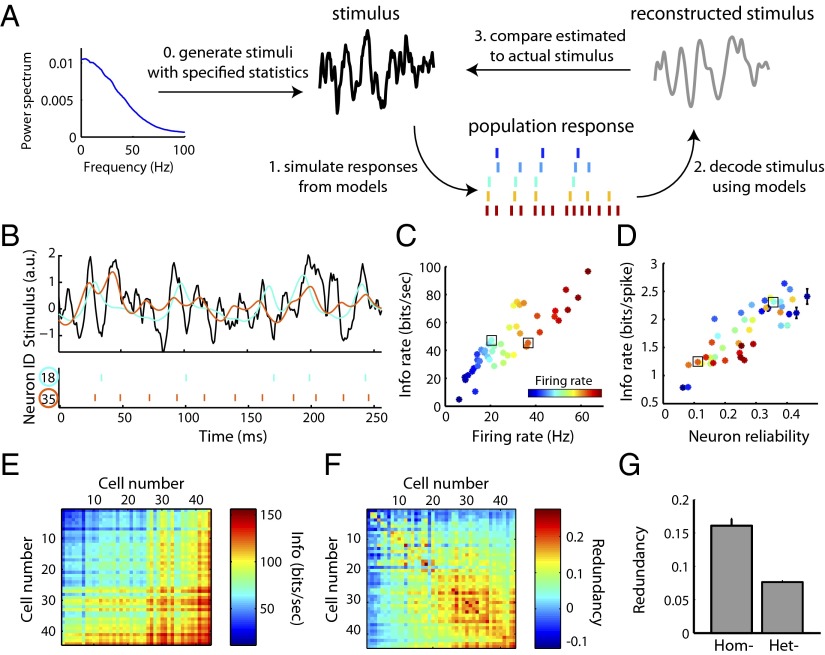
Fig. 2.
Using simulated ensemble responses to study stimulus representation in diverse neural populations. (A) Schematic of the paradigm used to study how neural populations represent stimuli. Following the generation of noisy stimuli, population spike responses were simulated using the MC models. Bayesian decoding was used to estimate the most probable stimulus given the population response and then compared with the actual stimulus. (B–D) Stimulus encoding by single neurons. Stimulus statistics and coloring of neurons same as in Fig. 1. (B) Stimulus (Top; black), spike trains (Bottom), and reconstructions (Top; cyan, orange) for two example neurons. These neurons encode the same stimulus differently, as evidenced by their unique spike trains and stimulus reconstructions. (C) Quantifying stimulus representation using mutual information (mean ± SEM, n = 44 cells) shows that a neuron’s information rate is strongly correlated with its firing rate (r = 0.87). Boxes indicate neurons shown in B. (D) As in C, but plotted as average information conveyed by single spikes as a function of neuron reliability. (E–G) Stimulus encoding by neuron pairs. (E) Mutual information for all neuron pairs with neurons ordered along axes by increasing firing rate. Values on (off) diagonal correspond to homogeneous (heterogeneous) pairs. (F) As in E but plotted as the normalized informational redundancy of the neuron pair. Positive (negative) values indicate population redundancy (synergy) where zero indicates independent stimulus encoding. 90% of pairs were redundant, yet overall redundancy values were small, indicating near-independent encoding. (G) Homogeneous pairs (Hom) are significantly more redundant than heterogeneous pairs (Het; P = 2.5*10−16, Wilcoxon, n = 44 and 946 pairs, respectively).

