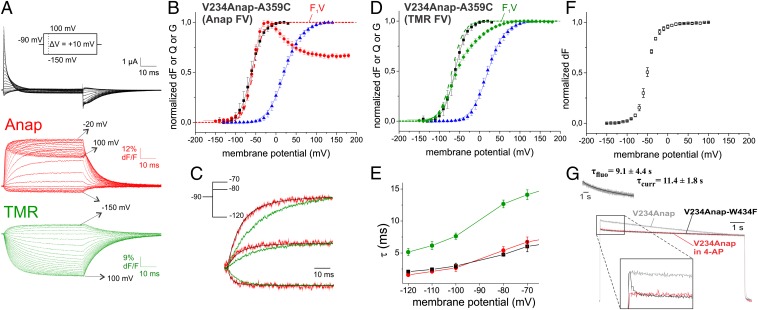
Fig. 2.
(A) Gating currents and fluorescence responses of a TMR-labeled oocyte expressing V234Anap-A359C in response to pulses from −90 mV to potentials between −150 and 100 mV. (B) Anap fluorescence voltage (FV, red circles), gating charge voltage (QV, black squares) and conductance voltage (GV, blue triangles) relations of V234Anap-A359C. The GV and QV were each fitted to Boltzmann relations (GV: V1/2 = 20.3 mV, dV = 20.6 mV; QV: V1/2 = −61.4 mV, dV = 14.5 mV). The FV was fitted to a sum of two Boltzmann relations (V1/2,1 = −56.7 mV, dV1 = 11.8 mV, V1/2,2 = −1.0 mV, dV2 = 25.4 mV). F1V refers to the first component of the FV. (C) Comparison of time dependence between charge movement (black) and fluorescence changes of V234Anap-A359C (red, Anap; green, TMR) for depolarizing pulses to voltages indicated in Inset. (D) TMR fluorescence voltage (FV, green diamonds) relation of V234Anap-A359C and the QV and GV with colors coded as in B. The FV was fitted to a sum of two Boltzmann relations (V1/2,1 = −68.7 mV, dV1 = 14.3 mV, V1/2,2 = 0 mV, dV2 = 23.0 mV). (E) Comparison among time constants of charge movement (black), Anap (red), and TMR (green) fluorescence of V234Anap-A359C. (F) Anap fluorescence voltage relation of the conducting mutant V234Anap. (G) Superposition of fluorescence traces obtained from a prolonged depolarizing pulse to 50 mV of oocytes expressing the conducting V234Anap mutant in absence (gray) or presence of 5 mM external 4-AP (red) and the nonconducting V234Anap mutant (black). The traces are normalized to the value at the end of the pulse. (Inset) Shown is the correlation between ionic current and fluorescence decay for the V234Anap-conducting mutant.

