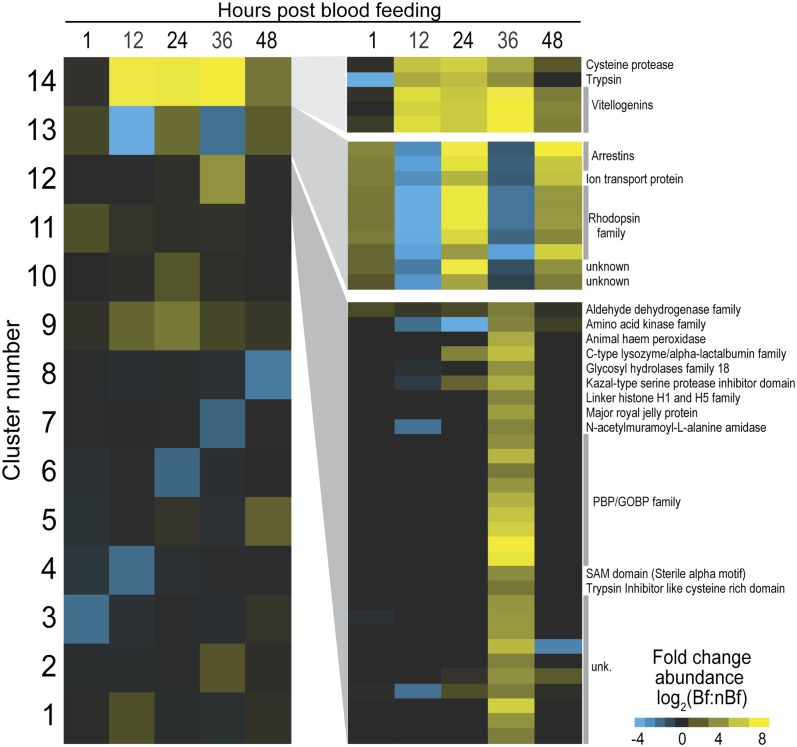
Fig. 1.
Cluster analysis of differential transcript abundances. Fourteen groups of genes displayed similar patterns of significant degrees of fold change in transcript abundance between blood-fed (Bf) and non–blood-fed (nBf) samples over all five time points. Log2 fold change scale indicates transcript abundances that were significantly higher (yellow) or significantly lower (blue) in Bf samples. (Left) Patterns of differential transcript abundances within each of the 14 clusters is shown in columns for 1, 12, 24, 36, and 48 h post-blood feeding. (Right) Differential expression of individual genes within cluster number 14 (Top), 13 (Middle), and 12 (Bottom). Log2 scale at Bottom Right indicates magnitude by with transcript abundances were significantly higher (yellow) or significantly lower (blue) in post-Bf samples relative to nBf samples.

