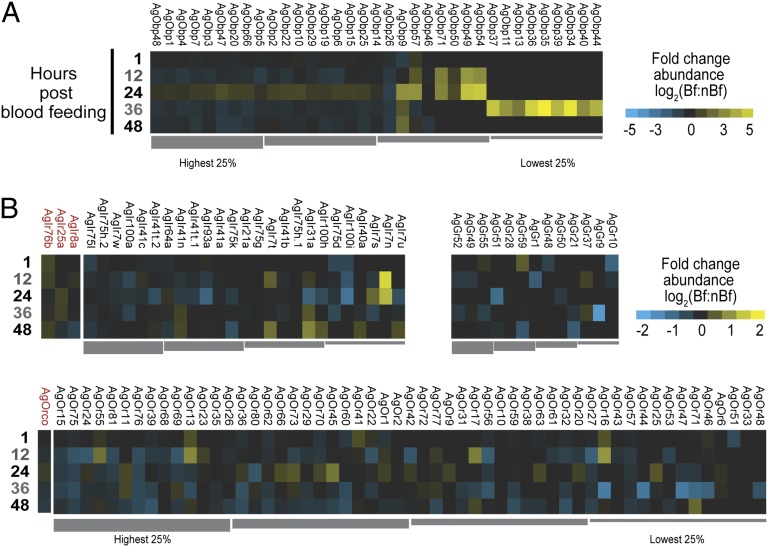
Fig. 2.
Antennal chemosensory differential transcript abundances following a bloodmeal. Chemosensory transcripts that were represented at significantly higher (yellow) or lower (blue) values in post–blood-fed samples; nondifferentially expressed chemosensory transcripts are denoted as zeros (black). Genes within each chemosensory gene family are arrayed left to right from most abundant to least based upon abundance levels seen within the 1-h Bf cohort. (A) Odorant binding protein family (AgObp). (B) Chemoreceptor families. (B, Upper Left) Variant ionotropic receptor family (AgIr) with the three AgIr coreceptors on the left (red); (B, Upper Right) Gustatory receptors (AgGr). (B, Lower) Odorant receptor family (AgOr) with the AgOr coreceptor (AgOrco) on the left (red). All transcripts were ordered left to right from highest to lowest RPKM values (quartile bars above or below each image). Log2 scales indicate transcript abundances that were significantly higher (yellow) or significantly lower (blue) in post-blood–fed samples. Note different scales for panel A and panel B.

