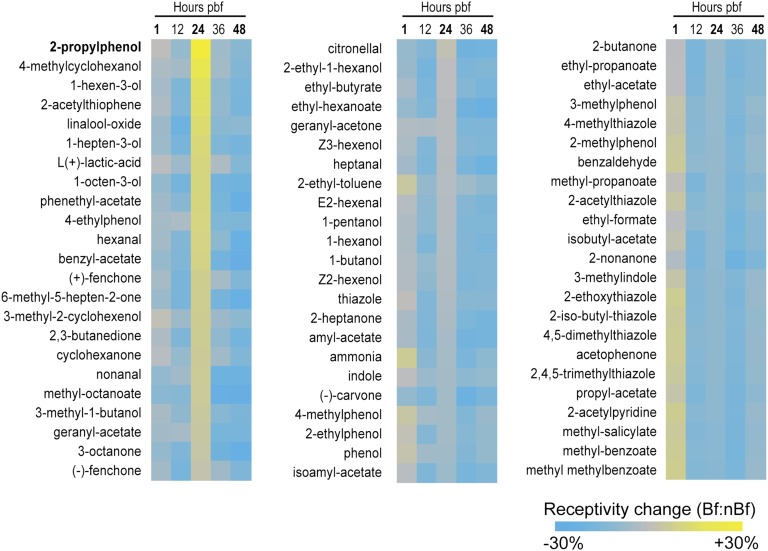
Fig. 3.
Calculated changes in AgOr-mediated odorant receptivity following a bloodmeal. Displayed are the conceptualized differences in antennal receptivity for a panel of 69 odors in post–blood-fed (Bf) vs. non–blood-fed females (nBf). Response characteristics to each chemical were based on known AgOr responses in heterologous expression systems and were then weighted by the relative antennal expression levels for each responding receptor. Results are sorted from high to low, based on the receptivity displayed by the 24-h post–blood-feeding time point. Scale bar shows calculated increases (yellow) and decreases (blue) in odor receptivity.

