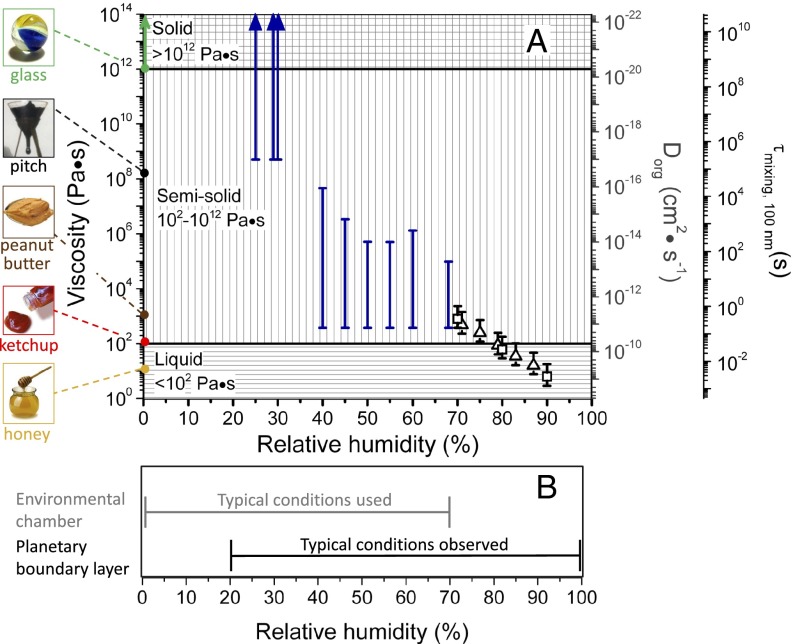
Fig. 2.
(A) Summary plot of the SOM viscosities determined by a combination of the “bead-mobility” [black open squares and triangles for Harvard Environmental Chamber (HEC) and PNNL samples, respectively, where the black bars represent the 95% prediction intervals] and “poke-flow” experiments (where the blue bars represent the bounds of the viscosities). HEC refers to samples collected on quartz fiber filters from the Harvard Environmental Chamber. PNNL refers to samples collected on Teflon filters from the Pacific Northwest National Laboratory Continuous-Flow Environmental Chamber. Various common substances have been placed alongside the diagram, along with their approximate viscosities at room temperature, to provide points of reference following the idea of Koop et al. (26). The secondary y axes show (i) diffusion coefficients of organic molecules (Dorg) in SOM calculated using the Stokes–Einstein relation and (ii) mixing times  of the particles due to bulk diffusion in 100-nm particles of the same viscosity (main text). The image of the pitch is a detail of an image from the pitch drop experiment (image courtesy of Wikimedia Commons, GNU Free Documentation License, University of Queensland, Australia, John Mainstone). (B) Typical relative humidities observed in the planetary boundary layer (23–25) and environmental chambers (52, 53).

