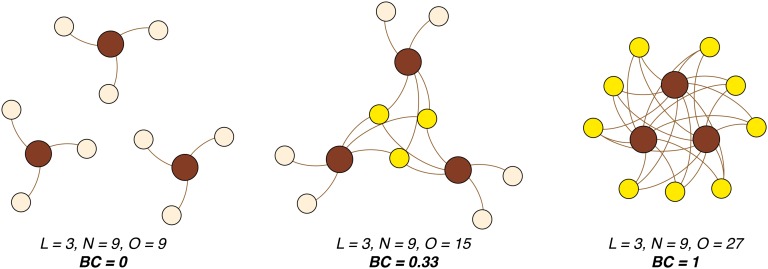
Fig. 2.
Bipartite networks exemplifying minimum to maximum scores of BC. Brown circles denote localities (geographic areas), tan circles denote taxa that occur at a single locality, and yellow circles denote taxa present at two or more localities. A taxon is connected to a locality if it occurs there.

