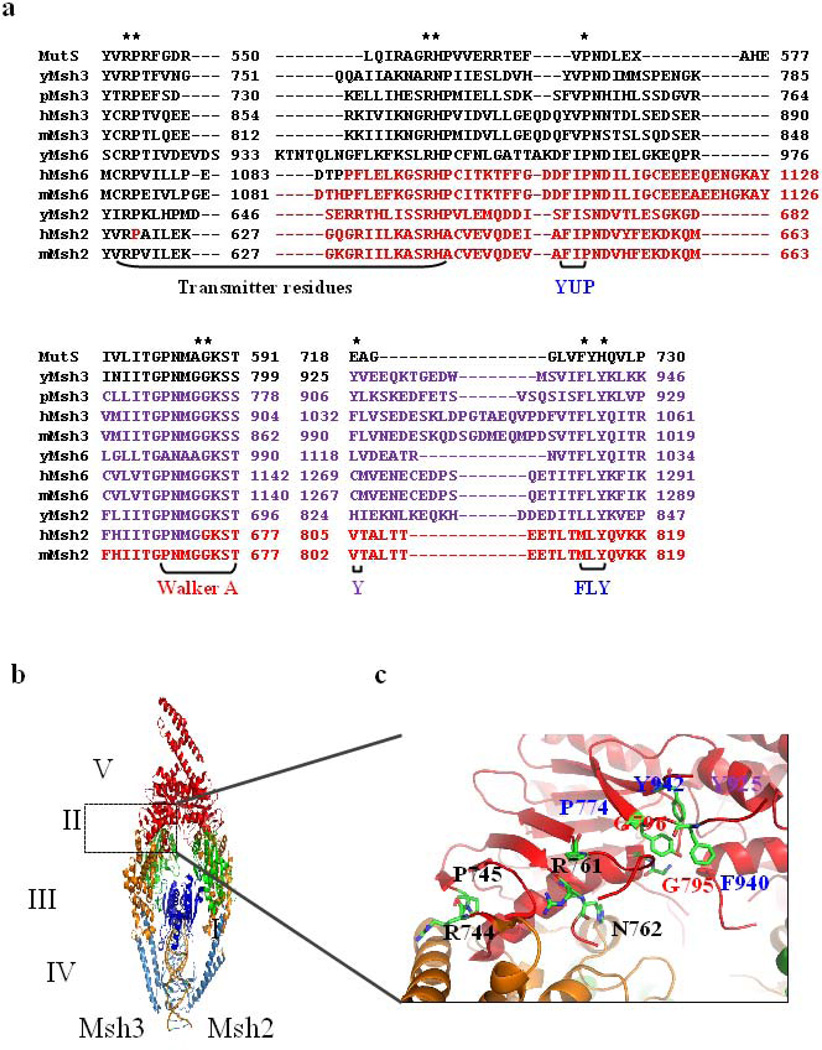
Figure 2. Residues in the transmitter region, Walker A, YUP and FLY motifs.
(a) Sequence alignment of Thermus aquaticus (TAQ) MutS with Msh2, Msh3 and Msh6 sequences from Saccharomyces cerevisiae (y), Schyzosaccharomyces pombe (p), Homo sapiens (h), Mus musculus (m). Residues colored in red represent HNPCC residues in hMsh2 and hMsh6. The regions targeted in this study are indicated by brackets below the alignment. Asterisks indicate residues mutated in this study. (b) The crystal structure of hMsh2-hMsh3 in complex with a four-loop substrate, based on the crystal structure 30. The subunit on the right is Msh2 and Msh3 is on the left. Domains in blue indicate DNA binding domains (domains I & IV), domains in green indicate connector domains (domain II), domains in mustard are the lever domains (domain III), and the ATPase domains (domain V) are in red. The interface of ATPase and lever domains is highlighted by the box. (c) Highlighted in the stick diagrams are residues targeted in this study. They are colored by element (carbon in green and nitrogen in blue). Molecular modeling images were acquired using PyMOL (The PyMOL Molecular Graphics System, Version 1.2r3pre, Schrödinger, LLC).

